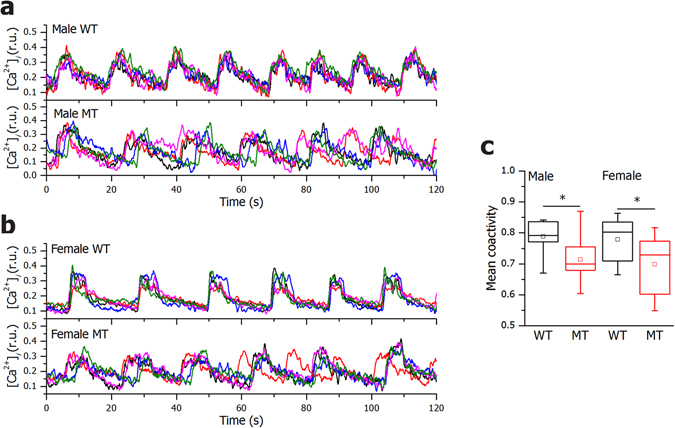
Figure 5.

SNAP-25b-deficient β cells display less synchronized Ca2+ oscillations. Five typical [Ca2+]i traces recorded during 12 mM glucose stimulation in a given slice from 12 week old WT and MT males (a) and WT and MT females (b). Mean coactivity coefficient pooled from all slices in a given sub-group for males and females (c). WT males, n = 4, 8 islets, MT males, n = 4, 9 islets, WT females, n = 3, 11 islets, MT females, n = 5, 11 islets. The box charts are defined in the same way as in Fig. 3. WT mice, black bars; MT mice red bars. *P < 0.05.
