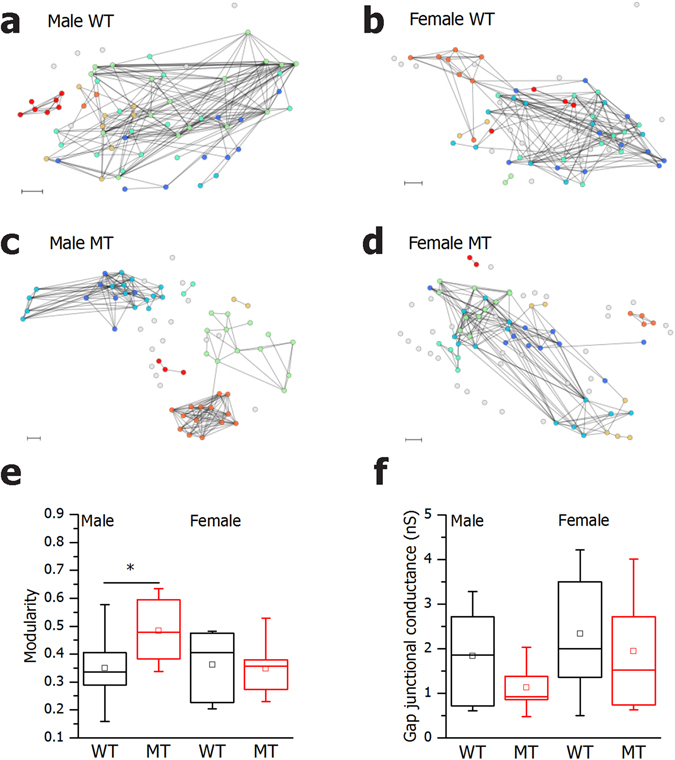
Figure 6.

SNAP-25b-deficient β cells display disrupted β cell networks upon glucose stimulation. Representative functional β cell networks extracted on the basis of the synchronization level between a given pair of cells (a–d). Modularity of all functional networks in 12 week old males and females (e) WT males, n = 4, 8 islets, MT males, n = 4, 9 islets, WT females, n = 3, 11 islets, MT females, n = 5, 11 islets. Gap junction conductance in β cells during patch-clamp experiments (f) WT males, n = 2, 10 cells, MT males, n = 2, 11 cells, WT females, n = 4, 17 cells, MT females, n = 2, 11 cells. The box charts are defined in the same way as in Fig. 3. WT mice, black bars; MT mice red bars. Scale bar 10 µm. *P < 0.05.
