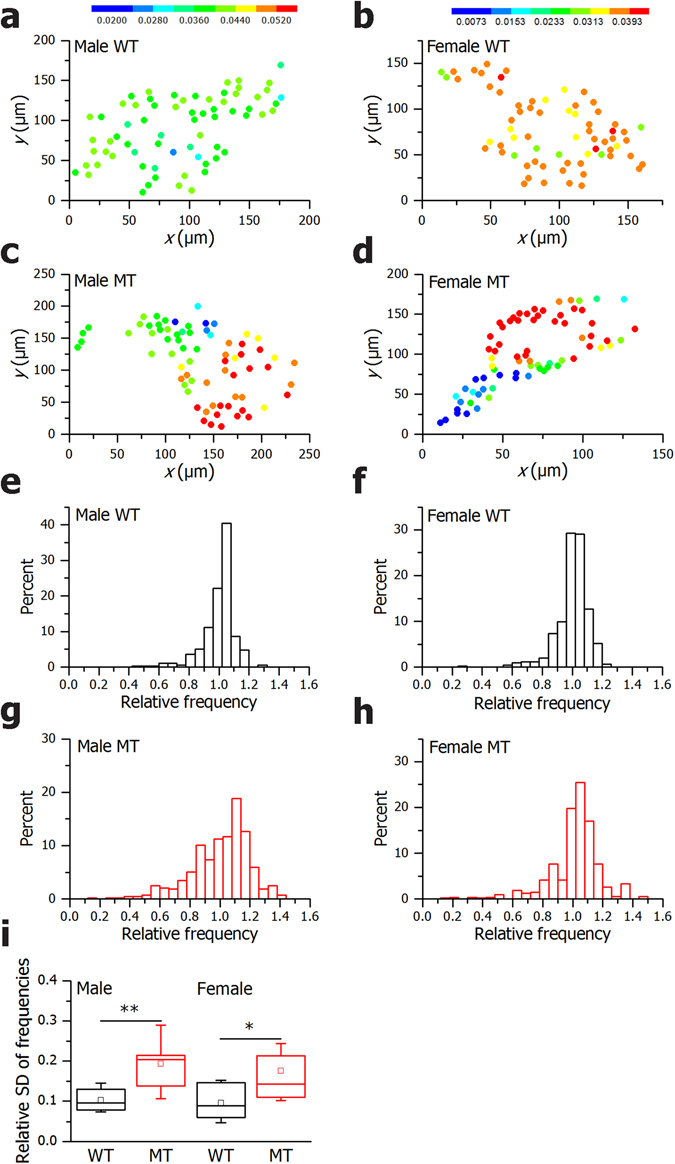
Figure 7.

In SNAP-25b-deficient islets the spatiotemporal Ca2+ activity is less coordinated. The coordinates of β cells with color coded frequencies of individual cells in a typical 12 week old WT and MT male (a and c), WT and MT female (b and d). The color-bars express the frequencies in Hz for males and females, independently as shown in left and right panel. The distribution of relative frequencies are shown (scaled to the mean frequency in a given slice) for all cells in a given subgroup (e–h). In (i) the relative standard deviations of frequencies in individual slices for different subgroups in males and females are displayed. WT males, n = 4, 8 islets, MT males, n = 4, 9 islets, WT females, n = 3, 11 islets, MT females, n = 5, 11 islets. The box charts are defined in the same way as in Fig. 3. WT mice, black bars; MT mice red bars. *P < 0.05.
