
Figure 2.
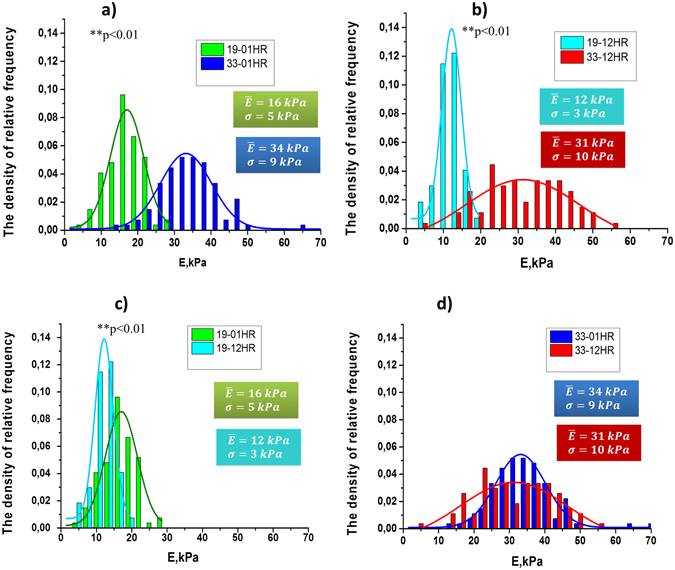
Histograms of the density of relative-frequency for values E for 19th and 33th days of PRBC storage and their approximation by the normal Gaussian distribution law. The density of relative frequencies is plotted along the ordinate axis, and the values of E is plotted along the abscissa axis. (a) 19–01 HR – 19th storage day, after 1 hour of rotation, 33–01 HR - 33th storage day, after 1 hour of rotation (**p < 0.01, differences are statistically significant). (b) 19–12 HR- 19th storage day, after 12 hour of rotation, 33–12 HR-33 days of storage, after 12 hours rotation (**p < 0.01, differences are statistically significant). (c) 19–01 HR and 19–12 HR - 19 days of storage, after 01 hour and 12 hours of rotation respectively (**p < 0.01, differences are statistically significant).(d) 33–01 HR and 33–12 HR - 33 days of storage, after 01 hour and 12 hours of rotation respectively (differences are not statistically significant). Em – the mean value of Young’s modulus, σ - the standard deviation.