Fig. 1.

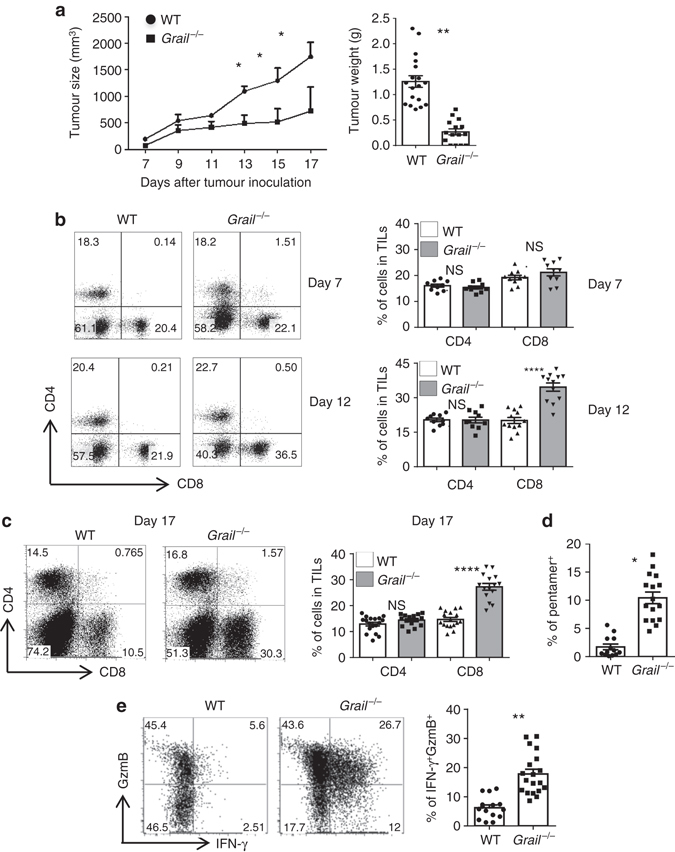
EG-7 lymphoma growth is dramatically reduced in the absence of Grail. a WT and Grail −/− mice were injected with EG-7 tumour cells subcutaneously on day 0. Tumour growth was monitored from day 7 and calculated as ½(ab 2), where a is the length and b is the width. EG-7 tumour weight in WT and Grail −/− mice after euthanasia is shown on the right graph. (n = 3 independent experiments with a total of 18 WT mice and 15 Grail −/− mice). b Tumour-infiltrating lymphocytes isolated from EG-7 tumours on days 7 and 12 were stained with anti-CD4 and CD8α antibodies. Numbers in dot plot indicate the percentage of cells within each quadrant from a representative tumour at each time point. Individual mice per group are shown for each time point on the right bar graph. (n = 10 mice per group from two experiments). c TIL were isolated from EG-7 tumours on day 17 and stained for CD4+ and CD8+ T cells as in b. The right bar graph shows the percentage of CD4+ and CD8+ T-cell subsets from individual mice per group. (n = 18 WT mice and 15 Grail −/− mice from three independent experiments). d TILs were stained with an OVA-specific pentamer and analysed in the CD8+ gate. (n = 18 WT mice and 15 Grail −/− mice from three independent experiments). e TILs were stimulated for 5 h with OVA peptide, followed by intracellular staining of IFN-γ and granzyme B (GzmB) and analysed in the CD8+ gate. Numbers in dot plot quadrants represent the percentages of each marker. The percent expression of CD8+IFNγ+GzmB+ TILs per mouse is shown on the right bar graph. (n = 18 WT mice and 15 Grail −/− mice from three independent experiments) *p < 0.05, **p < 0.01, ****p < 0.0001, NS as determined using one-way ANOVA. NS not significant
