Figure 2.

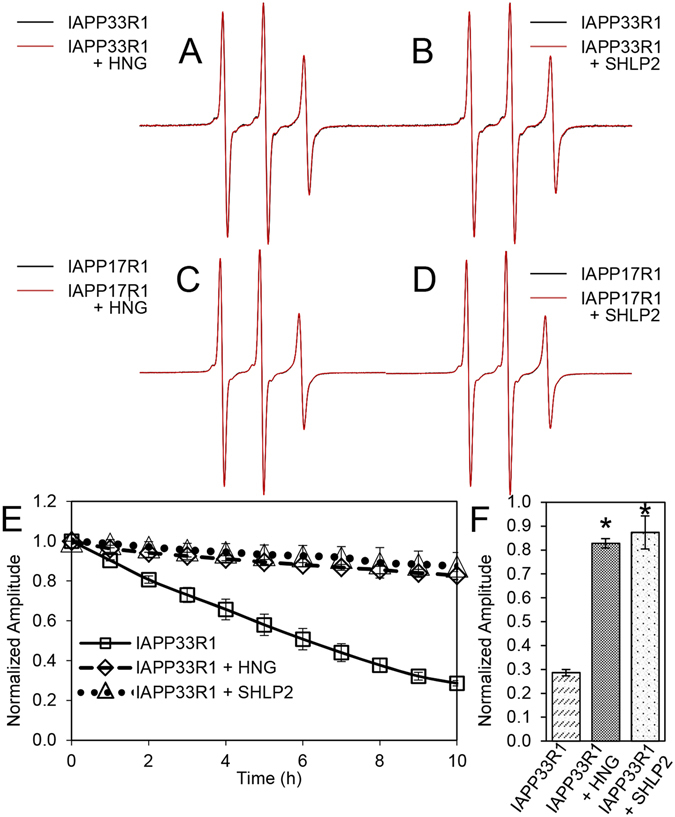
CW-EPR spectroscopy shows MDPs prevent loss of IAPP monomer without detectable binding to free IAPP. (A–D) EPR spectral overlay of (a) IAPP33R1 alone (black) and with HNG (red), (b) IAPP33R1 alone (black) and with SHLP2 (red), (c) IAPP17R1 alone (black) and with HNG (red), (d) IAPP17R1 alone (black) and with SHLP2 (red). (E) IAPP misfolding kinetics monitored over the course of fibrilization by central line amplitude. Symbols represent the following: (□) IAPP33R1, (◊) IAPP33R1 + HNG, (∆) IAPP33R1 + SHLP2. Error bars represent +/− 1 standard deviation. p-values of MDP treated vs. untreated IAPP33R1 at 1 hr <0.05, and at 2 + hr <0.01. (F) Average central line amplitudes for MDP treated IAPP33R1 at hour 10, *p = 0.001. Error bars represent +/− 1 standard deviation from a minimum of 3 experiments.
