Figure 3.

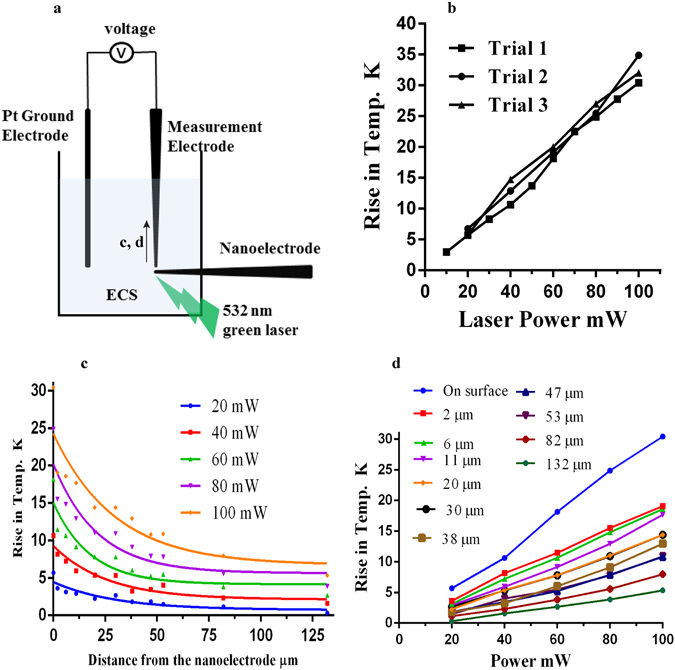
Localized temperature rise measurements. (a) Schematic diagram of the plasmonic temperature rise measurements on/near the surface of the nanoelectrode. The experiments were performed in a 35 mm Petri dish filled with extracellular solution (ECS). The measurement electrode was a glass micropipette filled with ECS. A change in resistance was measured in response to a 532 nm green laser focused on the nanoeletrode tip. The resistance vs temperature function was utilized to get the temperature values. (b) The rise in temperature on the surface of the nanoelectrode has a linear relation with laser power. (c) The temperature decays exponentially with the distance away from the nanoelectrode. The different colors indicate the different laser power settings. The results were fitted to the equation: T = (To − C)*exp (−kx) + C [parameter values are provided in Supplementary Table 1]. (d) Plasmonic temperature rise versus laser power at different distances away from the nanoelectrode.
