Figure 4.

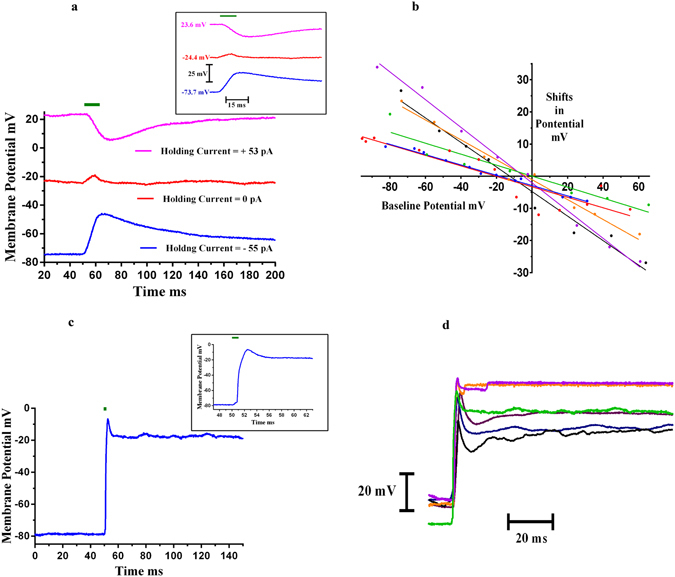
Activation of SH-SY5Y Neural Cells – Whole Cell Current Clamp Recording. (a) When a 532 nm green laser (denoted by the green bar), 10 ms pulse, having a power of 100 mW was shined on the tip of the nanoelectrode, a change in cell membrane potential was observed. The inset shows the onset response in more detail (faster time scale). The recordings were done in whole cell current clamp configuration. The figure shows shift in evoked potentials at three different baseline potentials; −73.7 mV (applied holding current = −55 pA), −24.4 mV (applied holding current = 0 pA) and +23.6 mV (applied holding current +53 pA). (b) The change in evoked potential varied with membrane potential; positive for −30 mV or less, and negative for 20 mV or more. Shifts in evoked potential vs baseline membrane potential for six different cells are shown, each represented by a different colour. (c) For 1–5 ms laser pulses (75–120 mW laser power), action potentials were recorded from the SH-SY5Y neural cells. The figure shows a representative action potential recorded from an SH-SY5Y cell for a 1 ms laser pulse at 100 mW laser power. The inset shows the zoomed portion of the onset response of the same. The cell membrane baseline potential was −78.5 mV (applied holding current =− 35 pA). (d) Action potentials recorded from the six different neural cells, each cell shown in a different colour. All the experiments were done in whole current clamp mode using an electrophysiological patch clamp system.
