Figure 5.

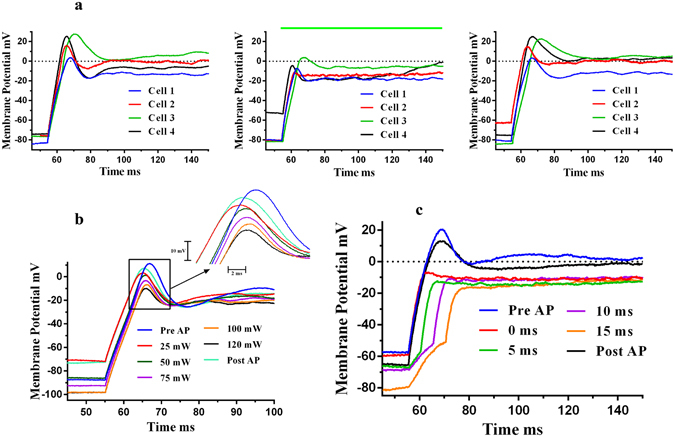
Inhibition of action potentials of SH-SY5Y neural cells - Whole Cell Current Clamp Recording. When laser pulses were superimposed on the responses to electric current pulses, a reduction in magnitude of action potentials was observed. (a) The figures show responses for four different cells. Left: Action potentials (Pre-AP) recorded when cells were stimulated with electric current pulses, (180 pA, 300 ms) – control conditions. Middle: A 300 ms, 120 mW, 532 nm green laser pulse (shown by green bar) was superimposed on the electric current pulse (180 pA, 300 ms), cell shows a reduction in the amplitude of action potential. Right: Action potential recorded post laser experiments, returns to the original value. The temp. rise of around 20 K was experienced by ~5–10% cell area. (b) The inhibition of action potential is affected by laser power. As laser power increases, inhibition becomes more prominent - AP peak decreases with laser power. The pulse width was 300 ms. (c) The inhibition of action potential is more prominent when the laser pulse led the electrical pulse by a few milliseconds as shown in a representative cell.
