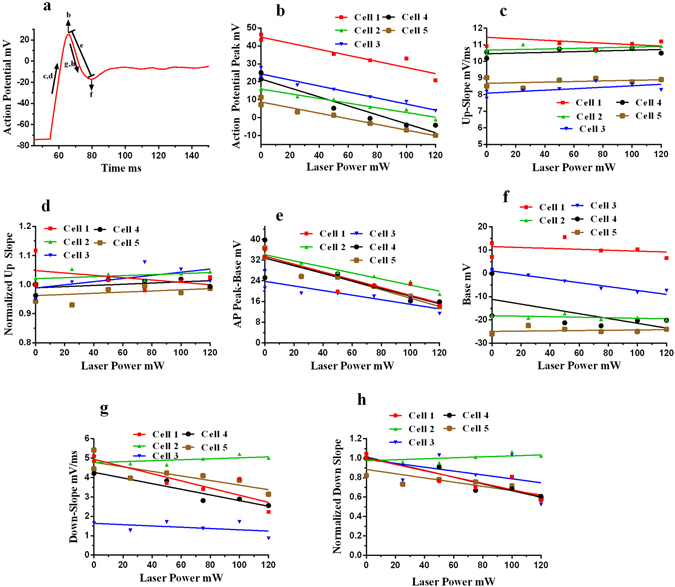
Figure 6.

Analysis of inhibition experiments. (a) A representative figure indicating the various analyses done for inhibition experiments as function of laser power, shown in subsequent parts. (b) Action potential peak decreases as the laser power increases, shown for five different cells. (c) The rate of rise of action potential (mV/ms) remains unaffected by the laser power as shown in up-slope vs laser power curves for five different cells. (d) All the up-slope values were normalized with initial up-slope (Pre-AP up-slope) which shows same trend of having no change with laser power like absolute values in (c). (e) The difference between AP peak and base value (first minima after peak) decreases with laser, because of the decrease in peak values of AP (b). (f) The base value (first minima) remains the same, doesn’t vary with laser power. (g,h) The down-slope and normalized downslope (downslopes normalized with downslope of pre-AP down-slope) decrease with laser power. The points with zero laser power belongs to electrical stimulations alone, control condition.
