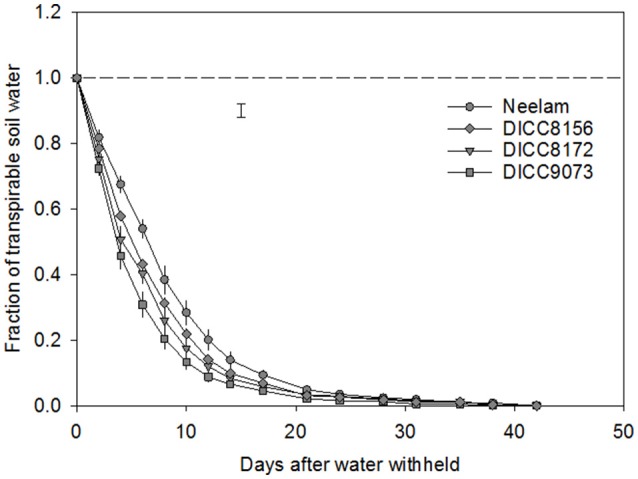
Figure 1.

Change in the fraction of transpirable soil water (FTSW) in the water-stressed (WS) treatment with time after the start of water treatments (100 DAS) in four chickpea genotypes: Neelam, DICC8156, DICC8172, and DICC9073. The dashed line represents FTSW in the well-watered (WW) treatment, which was maintained at 1.0 by watering to 80% field capacity every 2 days. The bar represents the least significant difference (LSD) at P = 0.05 for the interaction between genotype × days of treatment in the WS treatment. Data are means ± s.e.m. (n = 4). The data for the other six genotypes are in the Figure S1.
