
Figure 4.
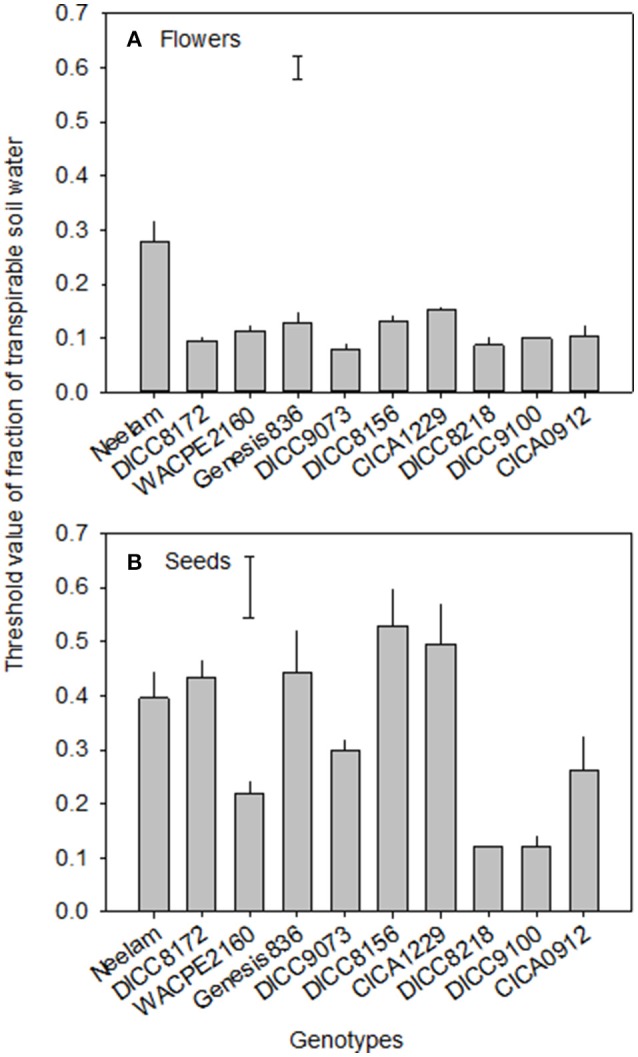
The values of the fraction of transpirable soil water (FTSW) at which flowering (A) and seed set (B) ceased in 10 chickpea genotypes in the WS treatment (terminal drought). Data are means ± s.e.m. (n = 4). Bars represent least significant difference (LSD) at P = 0.05 among genotypes.