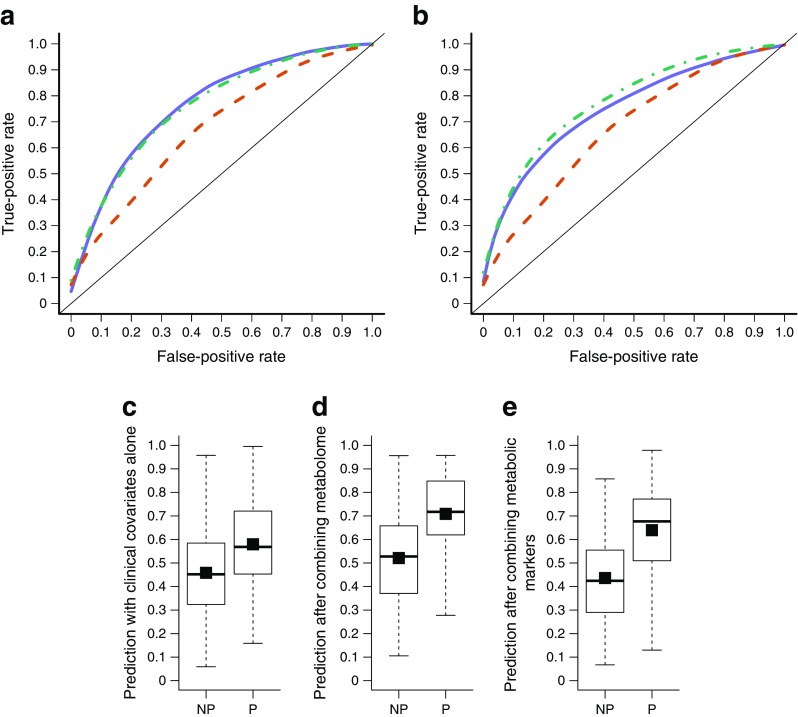
Fig. 2.
ROC curves of the predictive models based on (a) the entire metabolome (i.e. set of 568 metabolites) and (b) selected metabolic markers: glucose, mannose, α-HB, X-12063, α-tocopherol, [Hyp3]-BK and X-13435. The mean AUC value obtained with the clinical-only model was 0.68 (95% CI 0.48, 0.86) (red dashed line). (a) The metabolome-only model (solid blue line) had a mean AUC of 0.77 (95% CI 0.62, 0.90), while the combined model (green dashed-dot line) had a mean AUC of 0.76 (95% CI 0.59, 0.92). (b) The selected metabolic markers (solid blue line) had a mean AUC of 0.75 (95% CI 0.59, 0.89), while the combined model (dashed-dot line) had a mean AUC of 0.78 (95% CI 0.61, 0.92). DS plots of (c) the clinical-only model (DS = 0.12), (d) the combined model with clinical covariates and 568 metabolites (DS = 0.19) and (e) the combined model with clinical covariates and metabolic markers (DS = 0.20). White boxes in the DS plots show the predicted probabilities for progressors (P) and non-progressors (NP), and the black squares inside the boxes show the mean probabilities per group. The IDI was 58% with the entire metabolome and 66.7% with the selected markers

