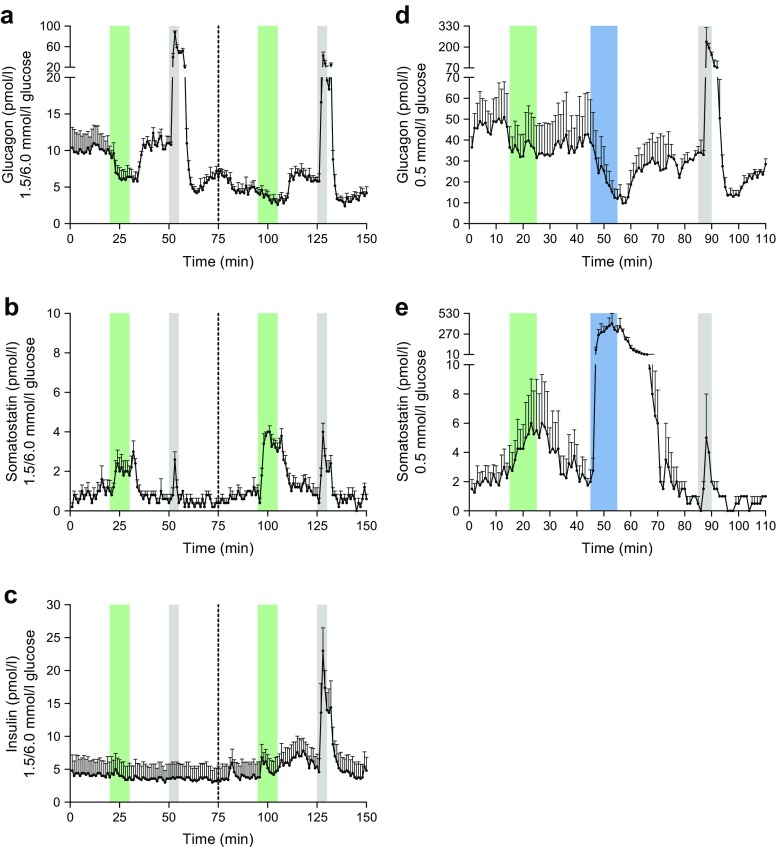
Fig. 1.
Concentrations of glucagon, somatostatin and insulin in venous effluents from mouse pancreas perfusion experiments with infusion of GLP-1, somatostatin and l-arginine at various glucose concentrations. Green bars, infusion period of 1 nmol/l GLP-1; blue bars, infusion period of 1 nmol/l somatostatin; grey bars, infusion period of 10 mmol/l l-arginine. (a–c) GLP-1 and l-arginine stimulation at 1.5 and 6.0 mmol/l glucose, n = 5. The dotted line at 75 min indicates the mid-experiment transition from 1.5 mmol/l to 6.0 mmol/l glucose in the perfusion medium. (a) Glucagon output; (b) somatostatin output; (c) insulin output. (d–e) GLP-1, somatostatin and l-arginine stimulation at 0.5 mmol/l glucose (buffer without pyruvate, fumarate, glutamate and Vamin). The first 70 min of data in (d–e) represents n = 4, whereas the end of the protocol (71–110 min), including the positive control, represents only n = 2. (d) Glucagon output; (e) somatostatin output. No insulin was detected at 0.5 mmol/l glucose. l-arginine was used as a positive control. Results are presented as mean + SEM

