Figure 5.

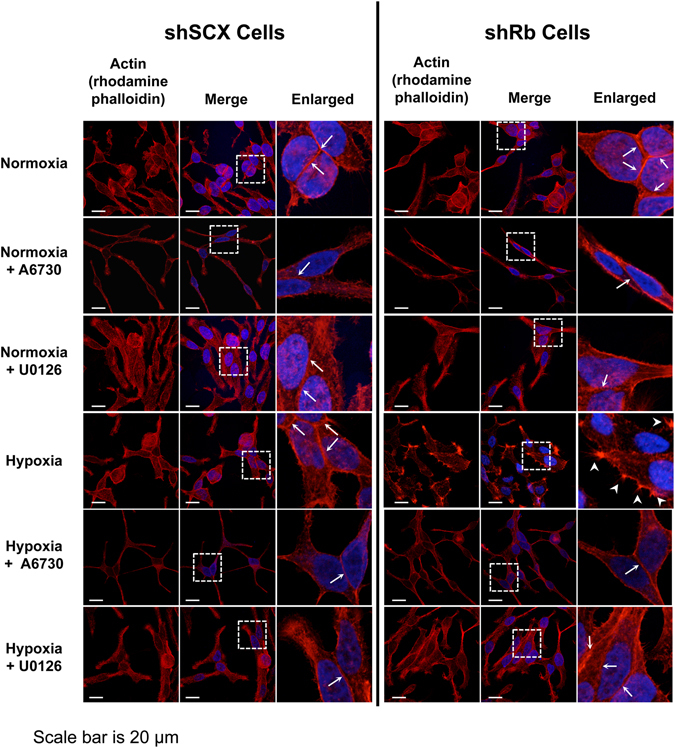
Immunofluorescence microscopy of actin in LNCaP cells. shRb and shSCX LNCaP cells were exposed to 72 h of hypoxia or normoxia and treated with or without 10 µM U0126 or 2 µM A6730. Fixed cells were treated with DAPI and TRITC-labelled rhodamine phalloidin and were imaged with a Zeiss LSM-780 confocal microscope. Phalloidin only images are represented in the left panels, merged images are in the middle panels and enlarged merged images are represented in the right panels. Filopodia-like processes are highlighted with large white arrow heads and cell:cell actin borders are shown with white arrows. Each experiment was repeated four times.
