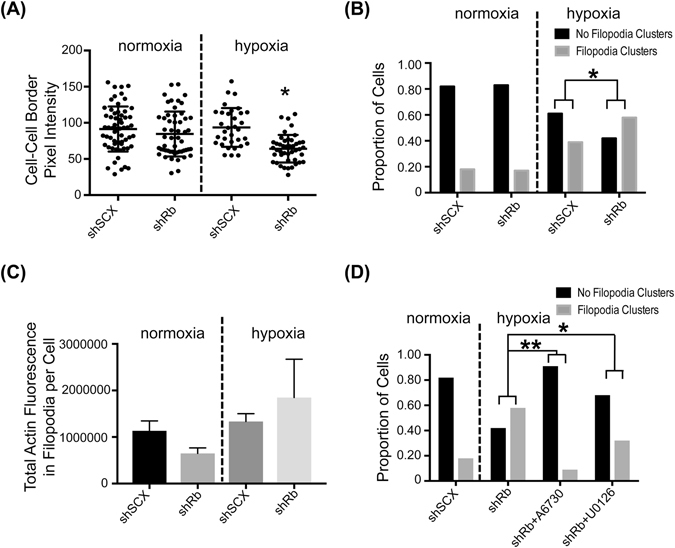
Figure 6.

Rb-loss and hypoxia alter the LNCaP actin cytoskeleton. (A) Scatter plot of pixel intensities measured along cell-cell boundaries. A double-blind analysis of cell-cell boundaries from normoxic shSCX (n = 60) and shRb (n = 53) and hypoxic shSCX (n = 33) and shRb (n = 44) conditions was conducted using ImageJ software. Horizontal black bars represent mean pixel intensities ± S.D., differences between means were determined by a Kruskall-Wallis with Dunn’s multiple comparisons test, *p-value < 0.05. (B) Proportion of cells categorized as having either no filopodia-like clusters (black bars) or filopodia-like clusters (grey bars). Cells from normoxic shSCX (n = 141) and shRb (n = 134) and hypoxic shSCX (n = 95) and shRb (n = 123) conditions were categorized through a double-blind analysis of phalloidin staining. Differences between populations were determined with a Fisher’s exact test, *p-value = 0.0065. (C) Total actin fluorescence in filopodia clusters per cell was determined by multiplying the phalloidin staining intensity by the area of each measured filopodia cluster. Phalloidin staining intensity and area of filopodia clusters were determined through a double-blind analysis of confocal images using ImageJ software. Data represents means ± S.E.M. (D) Proportion of hypoxia conditioned shRb cells categorized as having either no filopodia-like clusters (black bars) or filopodia-like clusters (grey bars) after treatment with vehicle (n = 123), 2 µM A6730 (n = 78) or 10 µM U0126 (n = 103). Cells were categorized through a double-blind analysis of phalloidin staining. The normoxic shSCX cells (n = 141) are shown as a negative control. Differences between populations were determined with a Fisher’s exact test, *p-value = 0.0002, **p-value < 0.0001.
