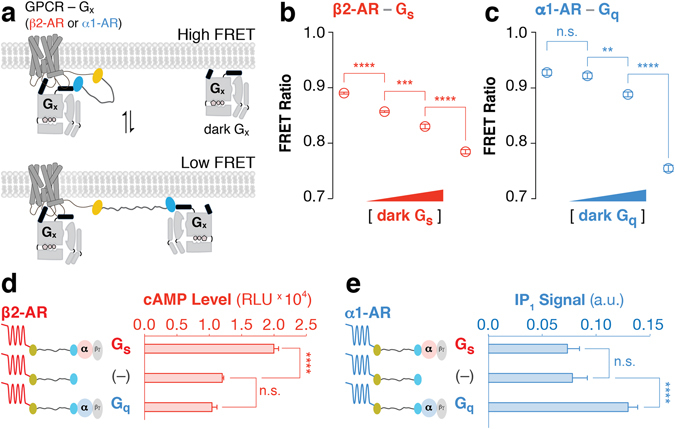
Figure 4.

Fusions modulate GPCR-G protein signaling relative to the endogenous cellular environment. (a) Schematic of competitive binding of un-tethered Gx (‘dark Gx’) to GPCR-Gx fusions. (b,c) FRET Ratios (525 nm/475 nm) for cells expressing GPCR-Gx fusion and cognate Gx after transient co-transfection with different concentrations of dark Gx DNA (0, 100, 300, and 1000 ng well−1). GPCR-Gx fusion DNA (2–4 μg well−1) was optimized to maintain equivalent expression across conditions. FRET Ratios for cells co-expressing (b) β2-AR-Gs fusions with unlabeled dark Gs (red) or (c) α1-AR-Gq fusions with dark Gq (blue). (d) Basal cAMP and (e) IP1 levels for cells expressing (d) β2-AR and (e) α1-AR tethered to Gs, Gq, or no G protein (–). (b–e) Data are derived from at least three independent experiments, with at least three replicates per condition (mean ± S.E.M. Student’s t-test was performed to evaluate significance with *p ≤ 0.05; **p ≤ 0.01; ***p ≤ 0.001; ****p ≤ 0.0001).
