Figure 5.

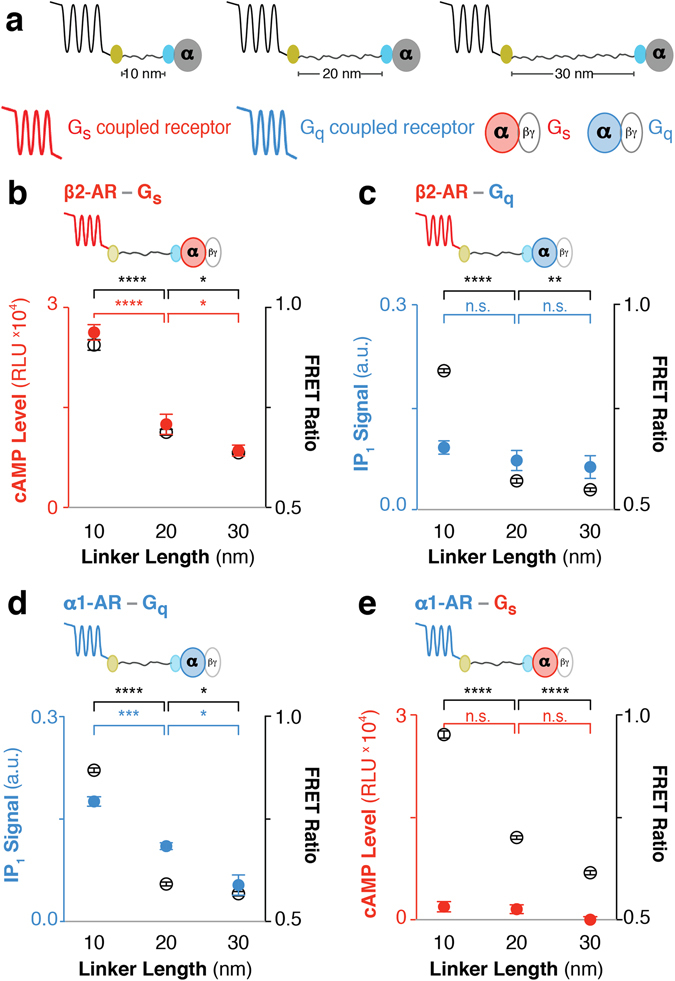
ER/K linker length specifically modulates basal β2-AR-Gs and α1-AR-Gq downstream response in live cells. (a) Schematic of the GPCR-G protein fusions. Color represents cognate GPCR-G protein pair and corresponding downstream response (red: β2-AR, Gs, and cAMP levels; blue: α1-AR, Gq, and IP1 signal). (b–e) Fusion type is indicated on the top left. FRET Ratios (525 nm/475 nm; open black circles, right y-axis) and basal (ligand-free) downstream response (filled colored circles, left y-axis) are compared to ER/K linker length (nm). (b) cAMP levels or (c) IP1 signal for β2-AR tethered to cognate Gs or non-cognate Gq respectively. (d) IP1 signal for cognate α1-AR-Gq fusions. (e) cAMP levels for α1-AR tethered to non-cognate Gs. (b–e) One-way ANOVA with a Tukey’s post-test was performed for FRET measurements (black) and downstream response (colored). Data are derived from at least three independent experiments, with at least three replicates per condition (mean ± S.E.M. *p ≤ 0.05; **p ≤ 0.01; ***p ≤ 0.001; ****p ≤ 0.0001). For additional statistical analysis see Supplementary Table 3.
