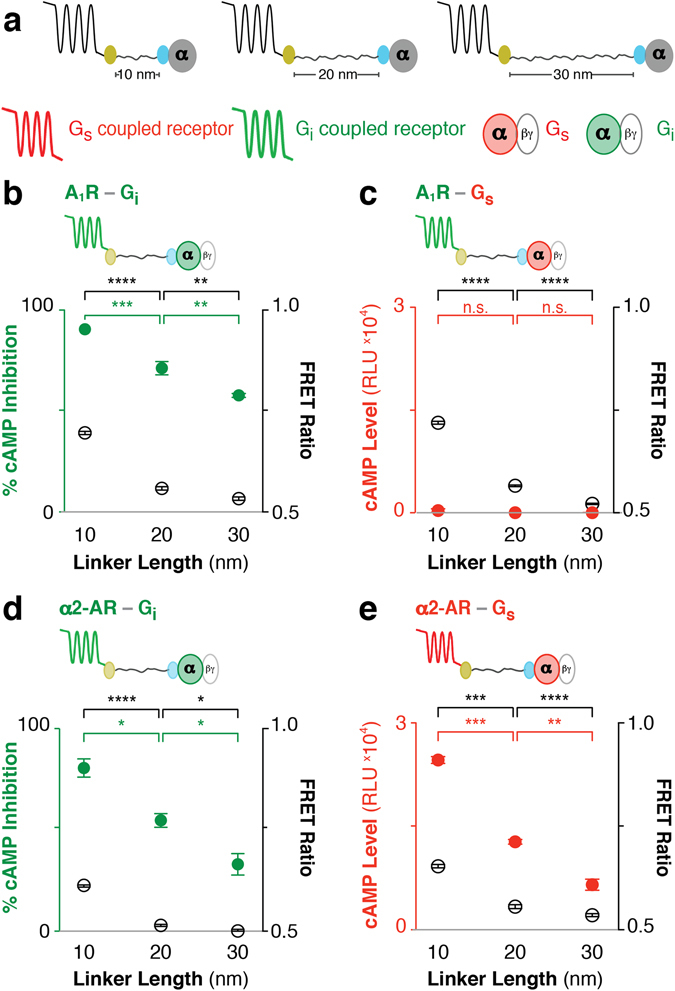
Figure 6.

ER/K linker length tunes basal GPCR-Gi protein downstream response in live cells. (a) Schematic of the GPCR-G protein fusions. Color represents cognate GPCR-G protein pair and corresponding downstream response (red: α2-AR, Gs, and cAMP levels; green: A1R, α2-AR, Gi, and cAMP inhibition). (b–e) Fusion type is indicated on the top left. FRET Ratios (525 nm/475 nm; open black circles, right y-axis) and basal (ligand-free) downstream response (filled colored circles, left y-axis) are compared to ER/K linker length (nm). (b) Percent inhibition of 1 μM forskolin induced cAMP production for canonical Gi coupled adenosine type 1 receptor (A1R). (c) Basal cAMP levels for A1R-Gs fusions. (d) % cAMP inhibition for Gi fusions and (e) cAMP levels for Gs fusions to α2-AR, a promiscuous Gs/Gi coupled receptor28. (b,d) Representative experiment with at least three replicates per condition. (c,e) Data are derived from at least three independent experiments, with at least three replicates per condition. (b–e) One-way ANOVA with a Tukey’s post-test was performed for FRET measurements (black) and downstream response (colored). Data are represented as mean ± S.E.M. *p ≤ 0.05; **p ≤ 0.01; ***p ≤ 0.001; ****p ≤ 0.0001). For additional statistical analysis see Supplementary Table 4.
