
Figure 7.
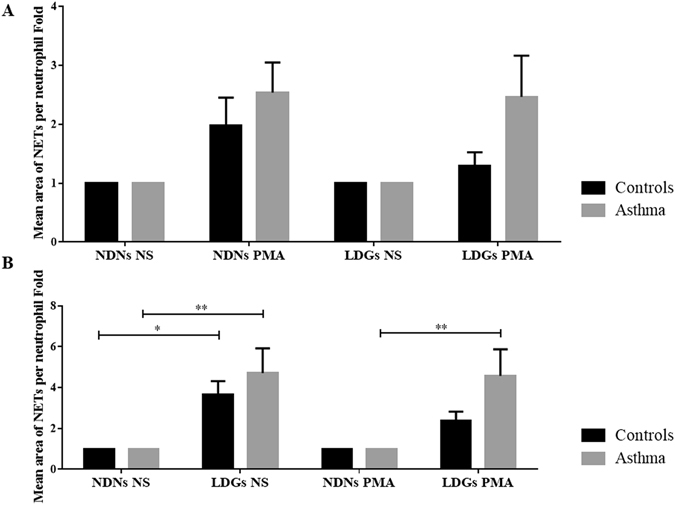
Fold changes of mean area of NETs per neutrophil in each layer of cells. (A) Results represent fold induction of the effects of PMA stimulation on the mean area of NETs per neutrophil on each layer of cells in each group of horses. Stimulation with PMA significantly increased the production of NETs in both groups of horses (p = 0.0008). Mean ± SEM for each studied population is shown. A two-way repeated measures ANOVA without Sidak’s multiple comparison post-tests has been realized in this case. (B) Results represent fold induction of the mean area of NETs per neutrophil by LDNs compared to NDNs in each group of horses, before and after stimulation with PMA. LDNs produced significantly more NETs than NDNs (p < 0.001). Mean ± SEM for each studied population is shown. *p ≤ 0.05 and **p ≤ 0.01.