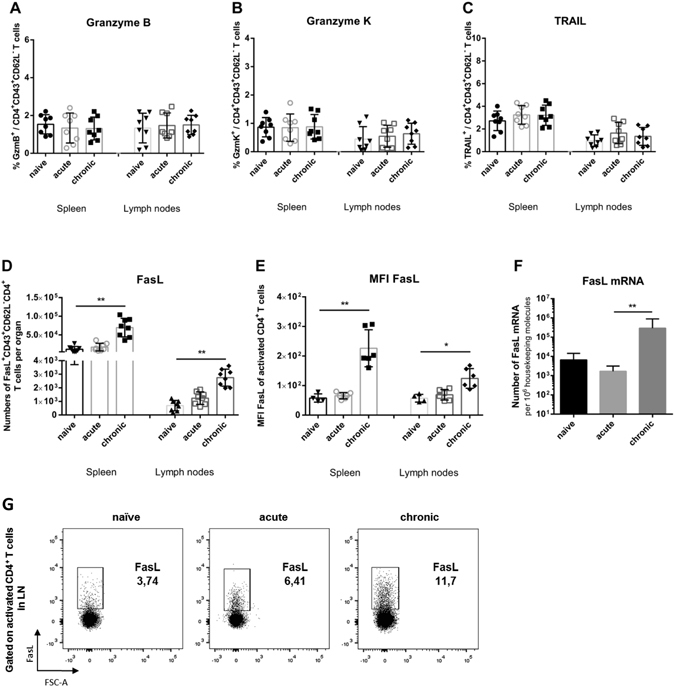
Figure 3.

Expression of cytotoxic molecules in effector CD4+ T cells from chronically FV infected mice. Flow cytometry was used to detect intracellular granzymes, or surface Fas ligand in activated effector CD4+ T cells (CD43+CD62L−). (A) Percentages of effector CD4+ T cells expressing granzyme B. (B) Percentages of effector CD4+ T cells expressing granzyme K. (C) Percentages of effector CD4+ T cells expressing TRAIL after restimulation with αCD3 and αCD28 antibodies in vitro. (D) Absolute numbers of effector CD4+ T cells expressing FasL after restimulation with αCD3 and αCD28 antibodies in vitro. (E) FasL expression is presented as in D), except that data are expressed as MFI. (F) mRNA levels for FasL in effector CD4+ T cells isolated from FV infected mice. β-actin was used as an internal standard. (G) Representative dot plots of FasL expression on activated CD4+ T cells from different phases of FV infection. Each dot represents an individual mouse. Mean values are indicated by a line. Statistically significant differences between the groups were determined by the unpaired t test: *p < 0.05; **p < 0.005. Data were pooled from at least two independent experiments.
