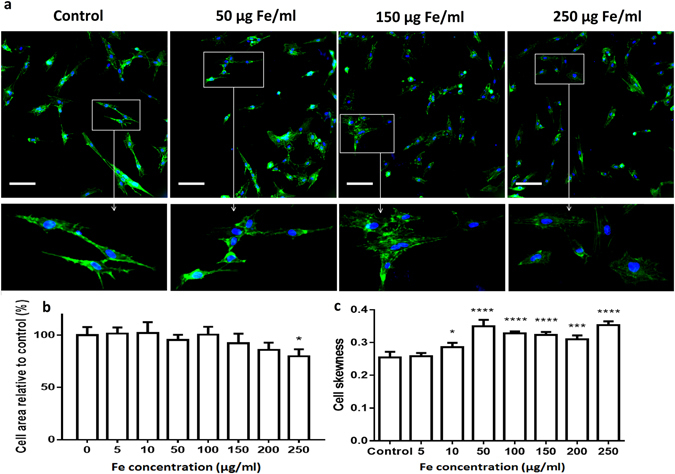
Figure 4.

(a) Representative images of high-content imaging setup of hMSCs stained for nucleus with Hoechst (blue) and for actin with Acti-stain 48 (green), scale bar 100 µm. From the images captured by high content analysis, the spreading of the cell was calculated (b), as well as the cell skewness (width of the cell over the length of the cell) as seen in (c). Data are represented relative to untreated control cells as mean ± SD for minimum 500 cells per condition, 3 replicates per condition. The degree of significance is indicated when appropriate *P < 0.05, **P < 0.01, ***P < 0.001 and ****P < 0.0001 (one-way ANOVA, Dunnett post-hoc test).
