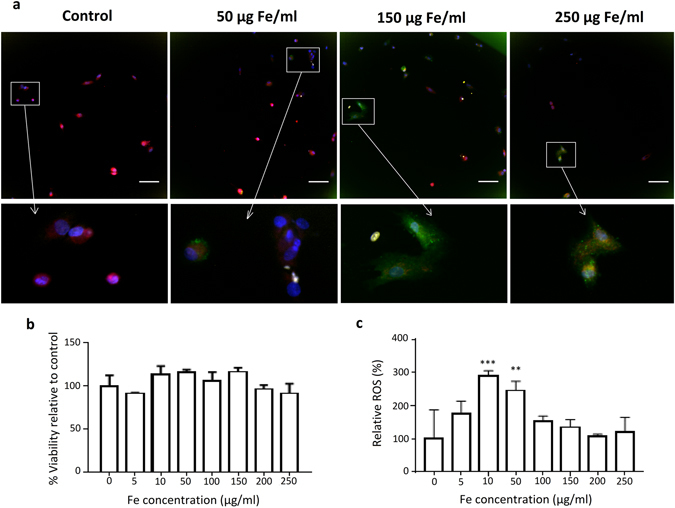
Figure 5.

(a) Cell viability (yellow), oxidative stress (green) and mitochondrial health (red) of hMSCs labelled with IONPs at various concentrations and determined by high-content imaging reveals significant induction of reactive oxygen species (ROS; green colour) at 10 and 50 µg Fe/ml. Scale bar 100 µm. (b) Relative viability and (c) production of reactive oxygen species determined by high-content imaging. Data are represented relative to untreated control cells as mean ± SD for minimum 500 cells per condition, scale bar 100 µm. The degree of significance is indicated when appropriate *P < 0.05, **P < 0.01 and ***P < 0.001 (one-way ANOVA, Dunnett post-hoc test).
