
Figure 8.
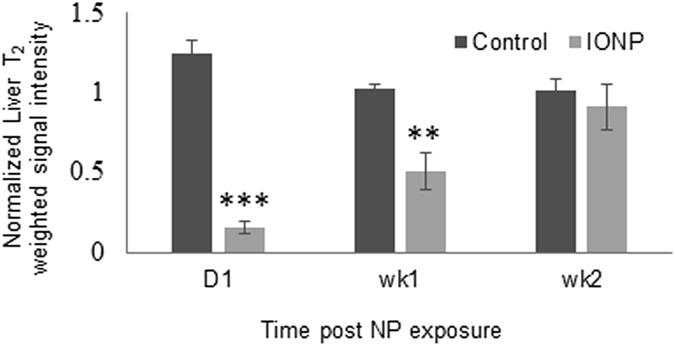
Quantification of the signal intensity of the specific region of interest defined as the liver, as evaluated from the MR images in mice administered PBS (control) and mice administered 60 µg Fe of IONP-DHCA after 1 d, 1 wk and 2 wk post IONP exposure. The signal was normalized against muscle tissue around the vertebra column. The analysis was conducted in replicates of three mice per condition over 2 wk. The degree of significance is measured using GraphPad Prism software and is indicated when appropriate *P < 0.05, **P < 0.01 and ***P < 0.001 (one-way ANOVA, Dunnett post-hoc test).