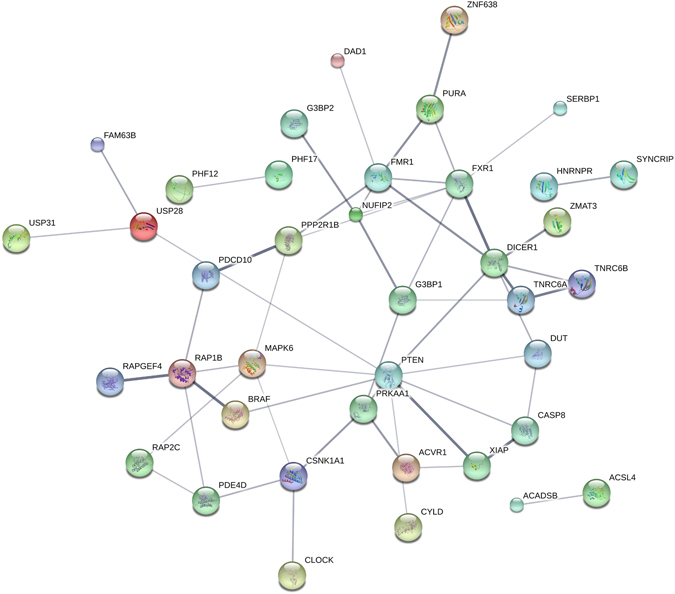
Figure 3.

ceRNA network of PTEN. Figure shows the protein-protein interaction (PPI) of PTEN and its top 100 predicted ceRNAs, showing only the connected components of the network. All genes are among the top 100 predicted ceRNAs and genes with PPI connection to at least one other ceRNA or PTEN are depicted. The PPI network is obtained from the STRINGD DB database. The thickness and the darkness of the edge correspond to confidence in the PPI interaction.
