
Figure 1.
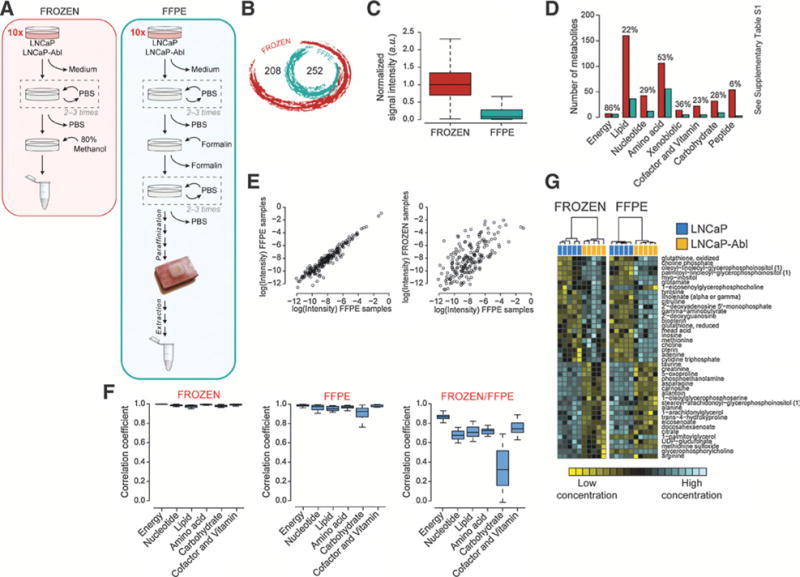
Isogenic cell lines. A, Schematic overview of the protocol used to prepare frozen and FFPE cell samples. The steps are discussed in Supplementary Methods. B, Venn diagram showing the intersection between frozen and FFPE metabolomic data in the experimental settings. C, Box-and-whisker plot representing the relative signal intensity of all shared metabolites found in frozen and FFPE samples. D, Bar plot of the metabolite number found in frozen and FFPE samples. The metabolites are categorized according to the class membership. The percentage above each bar represents the number of detectable metabolites (of each class) found in FFPE compared with frozen samples. E, Correlation plots between FFPE cell replicates and between frozen and FFPE cell samples. F, Box-and-whisker plots of the correlation coefficients, categorized to the class membership, between frozen replicates, FFPE replicates, and frozen and FFPE samples. G, Heatmap of selected metabolites from cell line samples. Hierarchical clustering (Ward method) based on KODAMA dissimilarity matrix is used for unsupervised classification. The phenotypic labels of the samples (i.e., LNCaP and LNCaP-Abl) are indicated as a colored band on top of the heatmap.