
Figure 4.
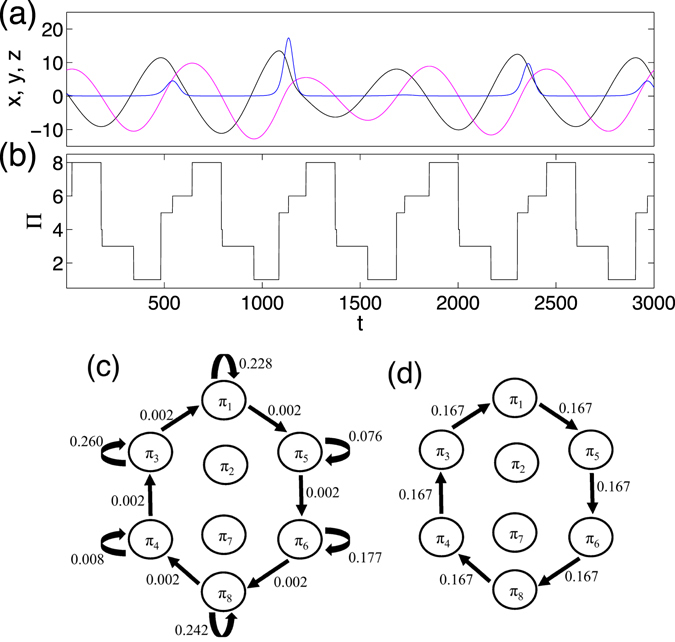
Chaotic Rössler system (a = 0.165): (a) short segments of time series (x, y, z), (b) temporal variation of order patterns corresponding to the particular time window of (a,c) ordinal pattern transition network with self-loops, , and (d) without self-loops, , where the transition route π 1 → π 5 → π 6 → π 8 → π 4 → π 3 → π 1 is observed. The values on links represent the corresponding transition frequencies of the ordinal patterns. Note that N = 500000 data points are used in obtaining (c,d).