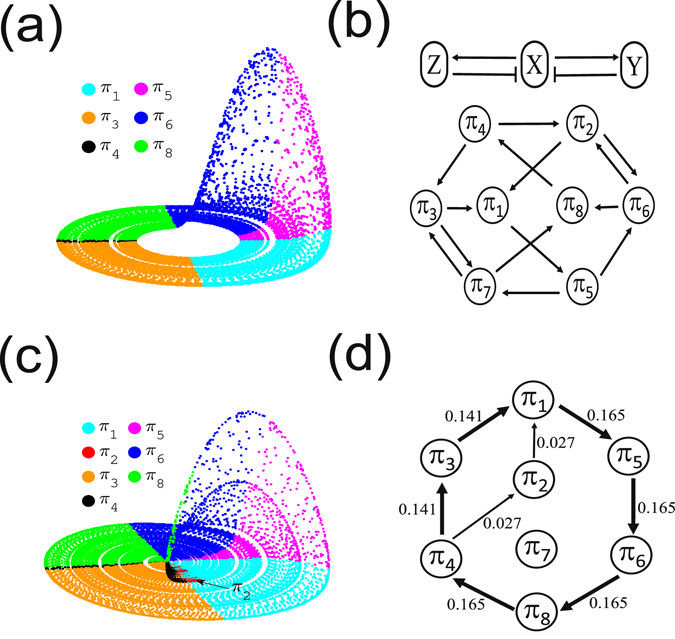
Figure 6.

(a) Rössler attractor (a = 0.165) in phase space color coded by ordinal patterns, which are indicated by legends. Patterns π 2 and π 7 are not observed. (b) Upper panel is the activation-repression relationship between variables x, y and z, where activation is denoted by a normal arrow, and repression by a barred arrow47; lower panel represents all allowed (not necessarily observed) pattern transitions of the system. The corresponding ordinal partition transition network is shown in Fig. 4(d). Panel (c) is the same as (a) with a = 0.26, where a significant number of π 2 patterns are highlighted, and (d) is the ordinal partition transition network (self-loops are excluded), where an alternative transition from π 4 → π 2 → π 1 has been observed.
