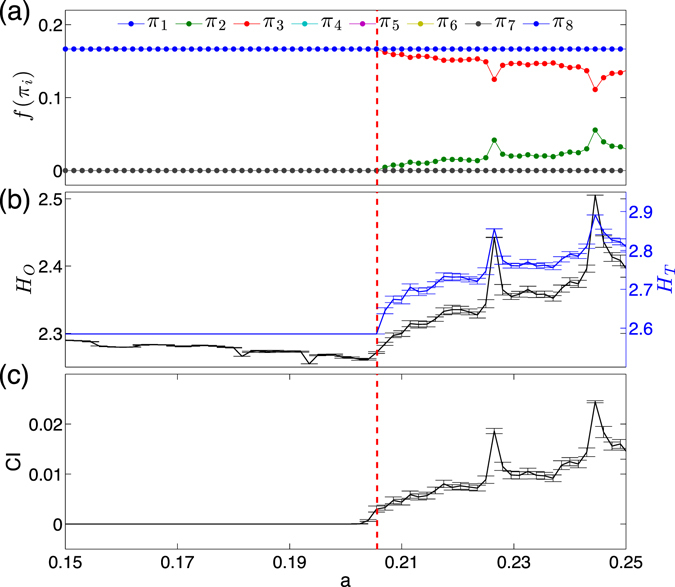
Figure 7.

Phase coherence to non-phase coherence transition for the Rössler system as a function of the parameter a (error bars indicate standard deviations obtained from 100 independent realizations of the system for each value of a: (a) frequency of each ordinal pattern f(π i), where π 1, π 4, π 5, π 6 and π 8 are overlapped in the entire range of a. (b) Entropy values and , (c) coherence index (CI). The transition from phase coherent to non-coherent is highlighted by the vertical dashed lines.
