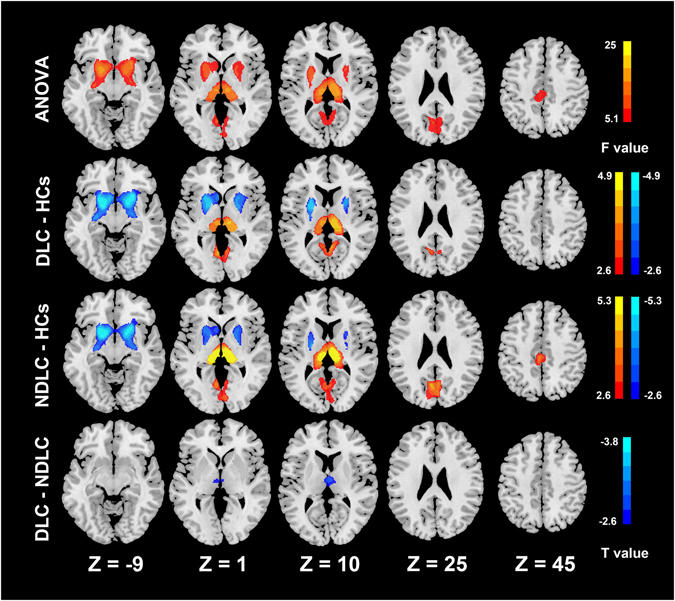
Figure 1.

Group differences of gray matter volume. ANOVA analysis shows the volume of the putamen, thalamus, caudate, cuneus, calcarine, middle cingulate cortex and bilateral lingual gyri have significant differences among three groups. Compared with healthy controls, the diabetic cirrhosis patients group shows decreased volume in the caudate and putamen and increased volume in the thalamus and lingual gyrus. Non-diabetic cirrhosis patients group has decreased volume in the caudate and putamen and increased volume in the thalamus, middle cingulate cortex, cuneus and calcarines. The diabetic cirrhosis patients group has decreased volume in the thalamus compared with the non-diabetic cirrhosis patients group (all p < 0.05). ANOVA = analysis of variance, DLC = diabetic liver cirrhosis, NDLC = non-diabetic liver cirrhosis, HCs = healthy controls.
