
Figure 2.
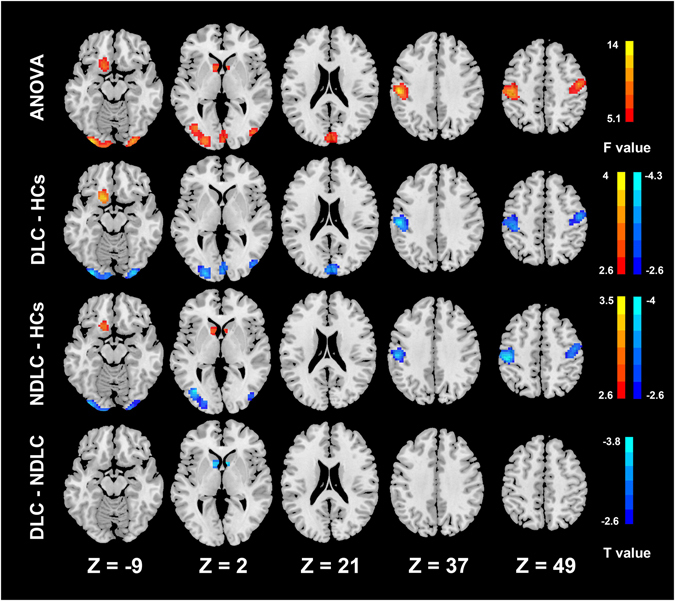
Group differences of fALFF. ANOVA analysis shows fALFF values of the caudate, occipital lobe, left postcentral gyrus, right precentral gyrus, left supramarginal gyrus and left frontal lobe have significant differences among three groups. Compared with controls, the diabetic cirrhosis patients group shows decreased fALFF values in the occipital lobe, left postcentral gyrus, right precentral gyrus and left supramarginal gyrus and increased fALFF values in the frontal lobe. Non-diabetic cirrhosis patients group has decreased fALFF values in the occipital lobe, left postcentral gyrus, right precentral gyrus and left supramarginal gyrus and increased fALFF values in the caudate and left frontal lobe. The diabetic cirrhosis patients group has decreased fALFF values in the caudate compared with the non-diabetic cirrhosis patients group (all p < 0.05). ANOVA = analysis of variance, DLC = diabetic liver cirrhosis, NDLC = non-diabetic liver cirrhosis, HCs = healthy controls.