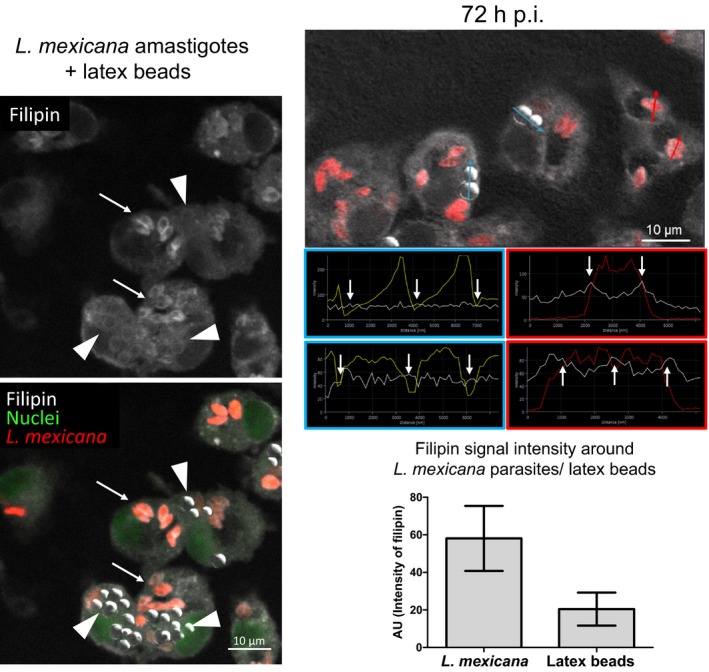
Figure 3.

Distribution and quantification of the filipin signal around Leishmania mexicana amastigotes and latex beads. Macrophages were simultaneously infected with L. mexicana amastigotes (MOI of 5) and incubated with latex beads (five per cell) for 2 hr. Distribution of filipin was analyzed 72 hr after infection. Cells were fixed and subsequently stained with filipin (white, excited at 405 nm) and SYTO ® 13 (nuclei, green, excited at 488 nm). Latex beads are visualized using the transmission channel. The image represents a confocal section acquired using a Zeiss LSM 780 microscope, 63× oil‐immersion objective. (left panel) Arrows indicate the presence Leishmania parasites (red, excited at 543 nm) and/or filipin‐stainable free cholesterol around the parasites. Arrowheads indicate selected latex beads incorporated by macrophages. One representative of three independent experiments is shown. (right panel top) Red arrows and charts outlined in red refer to representative linescans (measured with ZEN software) of L. mexicana parasites phagocytosed by macrophage. Arrows and charts outlined in blue refer to representative linescans of latex beads incorporated by macrophages. White arrows indicate signal intensities for filipin (white line) around latex beads (yellow line) and parasites (red line) that were used to quantify intensity differences in filipin staining. (right panel bottom) For quantification of filipin signal around internalized L. mexicana amastigotes and latex beads, maximal signal intensity (indicated as mean peak value in arbitrary units (AU) ± SD, n = 36 along section paths) was determined using ZEN (blue edition) software. Background values were subtracted from the absolute values. Differences between parasites and latex beads were highly significant p < .0001
