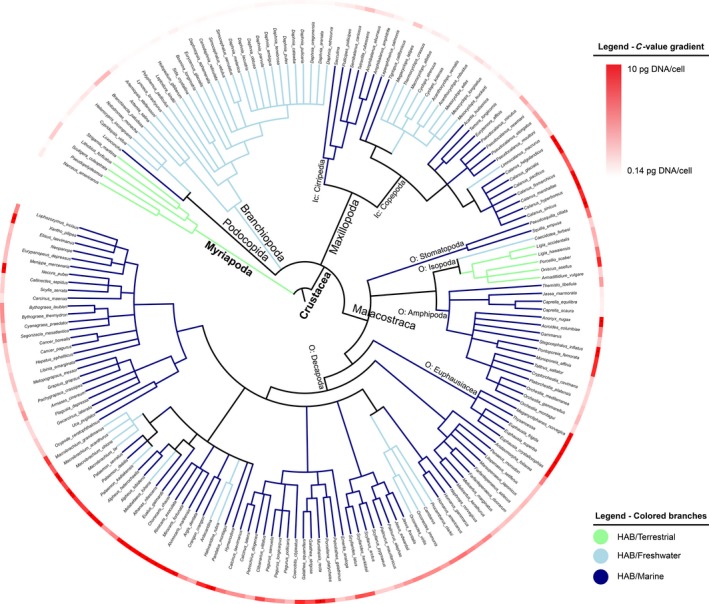
Figure 2.

Dendrogram of crustaceans with known C‐values (n = 182). C‐values (maximum shown value 10 pg DNA/cell) shown in outer circle in red gradient (minimum/light red = 0.14 pg DNA/cell, maximum/dark red = 10 pg DNA/cell). C‐values above the set threshold are marked with asterisk (*); specific C‐values may be retrieved from the Table S1. Branches colored according to habitat (green = terrestrial, light blue = freshwater, and dark blue = marine). Subphylum (in bold), class, and other notable groups (Ic = infraclass, O = order) shown next to branches
