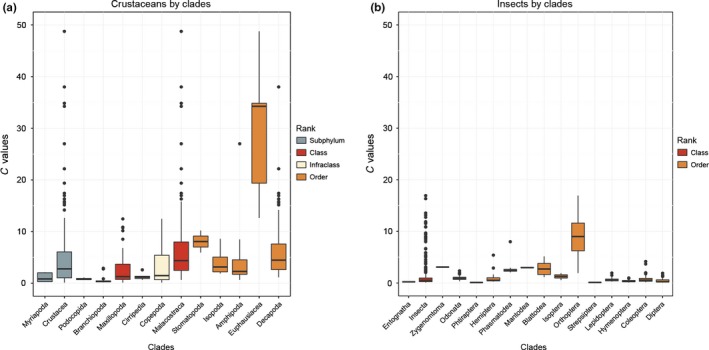
Figure 3.

C‐values by clades in crustaceans (a) (with representatives from the outgroup Subphylum Myriapoda as represented in Figure 2). The class Maxillopoda show the combined C‐values of the infraclasses Cirripedia and Copepoda, and the class Malacostraca show the combined C‐values of the orders Stomatopoda, Isopoda, Amphipoda, Euphausiacea, and Decapoda, and insects (b) (with representatives from the outgroup Class Entognatha as represented in Figure 1)
