
Figure 2.
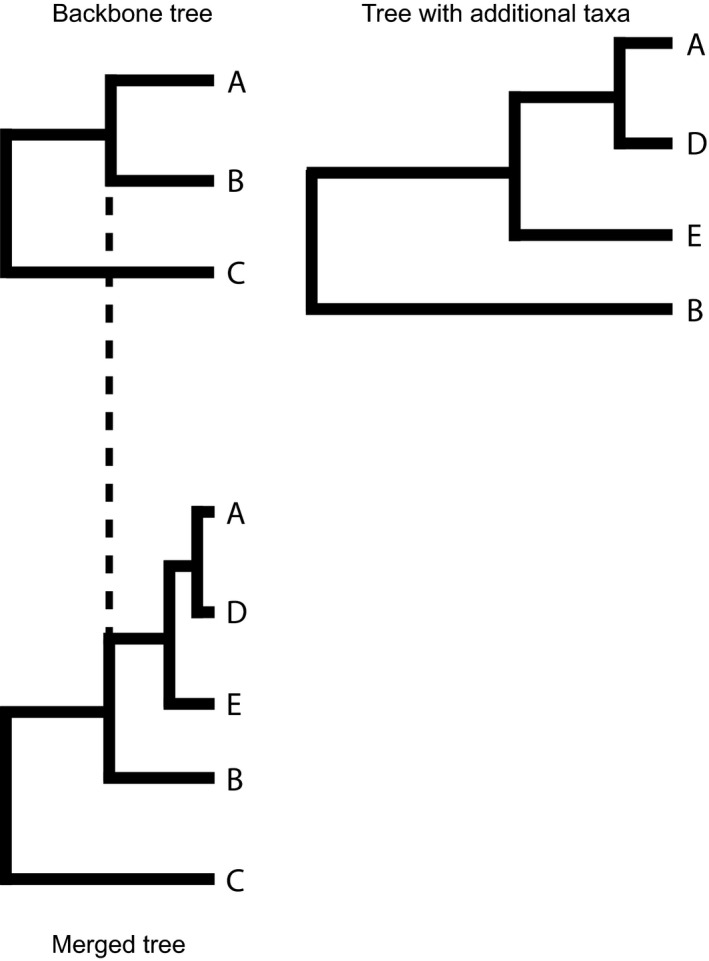
A visual representation of how more detailed information about a species group found in one tree can be integrated into a larger phylogeny by transforming branch lengths. In this example, the relationships between species A, D, E, and B are scaled to the same length that occurred in the backbone tree (for the clade consisting of species A and B)