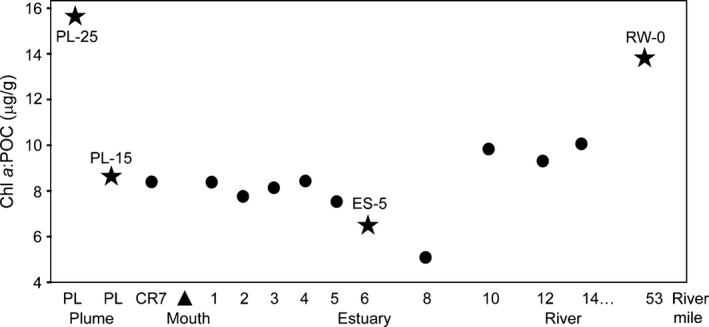
Figure 2.

Chl a:POC ratios calculated for whole water samples collected along an ocean to river transect in the time period from 31 July to 7 August 2010. Stars show the samples that were subsequently fractionated and used for metagenome sequencing. Circles show the samples that were used only for biogeochemical measurements. The x‐axis shows sampling locations along the ocean to river transect (not shown to scale for distance). Water samples collected beyond the mouth in the river plume are indicated with “PL” and “CR” (PL‐25, PL‐15, and CR7), while with locations of samples collected within the estuary and river are marked as river miles (RM) starting from the mouth (shown with the arrowhead) and ending at RM 53 (location of RW‐0 sample collection)
