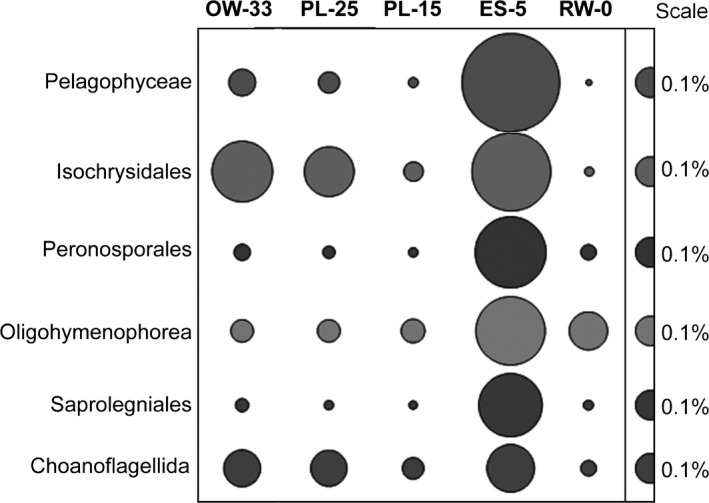
Figure 7.

Relative abundance of Protist taxa based on predicted gene annotations in assembled metagenomes. Relative abundance for each family was calculated as the percentage of corresponding genes (with ≥60% sequence identity over >70% of the alignment length) in all annotated CDS in a given metagenome. The abundance values are proportionate to the bubble width. The scale for each row is indicated with a half‐bubble to the right, and its diameter corresponds to a percentage value shown with a number. The metagenome names provide information on sampling locations and water salinity (PSU; OW‐33, ocean water; PL‐25 and PL‐15, plume; ES‐5, estuarine; RW‐0, freshwater)
