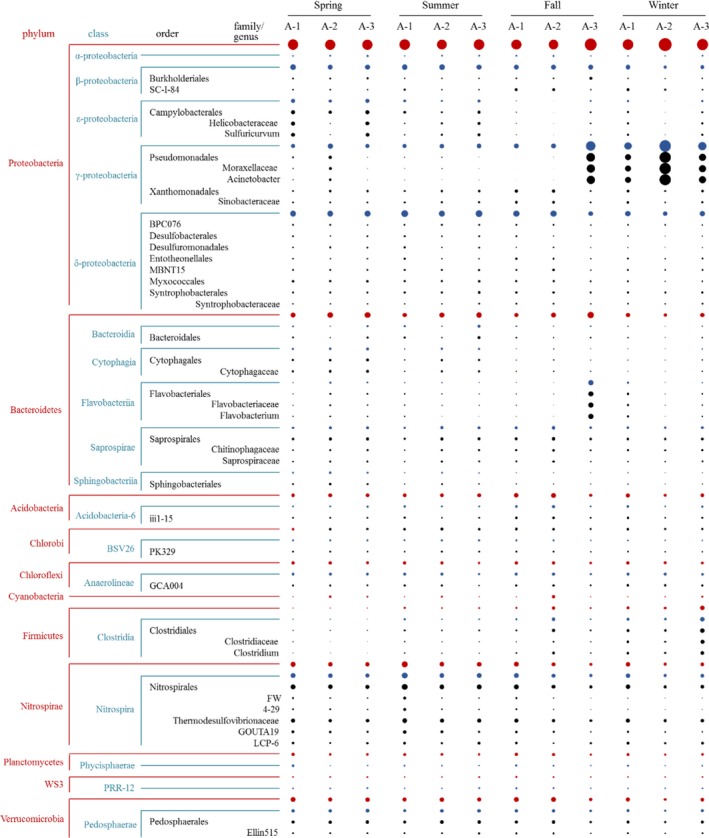
Figure 5.

The temporal and spatial variations characteristics of bacterial community structure in different bacterial taxonomical levels (only shown the sequence of bacteria >1% of all sequences). The size of the circle represented the relative abundance of bacteria at each site, and the color of the circle represents bacterial taxonomical levels, red is phylum, blue is class, black is order, family and genus
