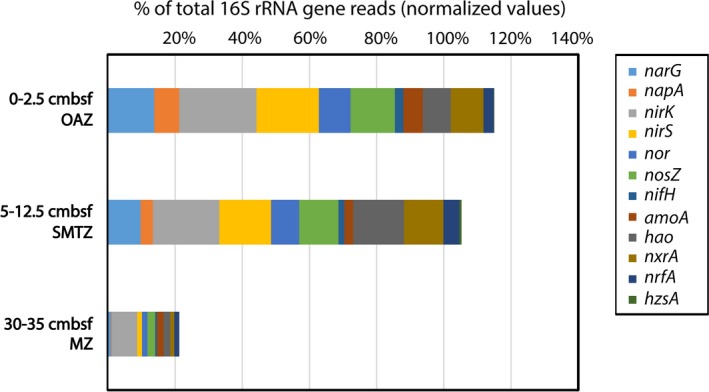
Figure 4.

Proportional distribution of N‐cycle related normalized gene reads in relation to total 16S rRNA normalized reads along the analyzed depth profile at site US5B in the Bothnian Sea. cmbsf, cm below sediment surface; OAZ, oxic/anoxic interface zone; SMTZ, sulfate methane transition zone; MZ, methanic zone
