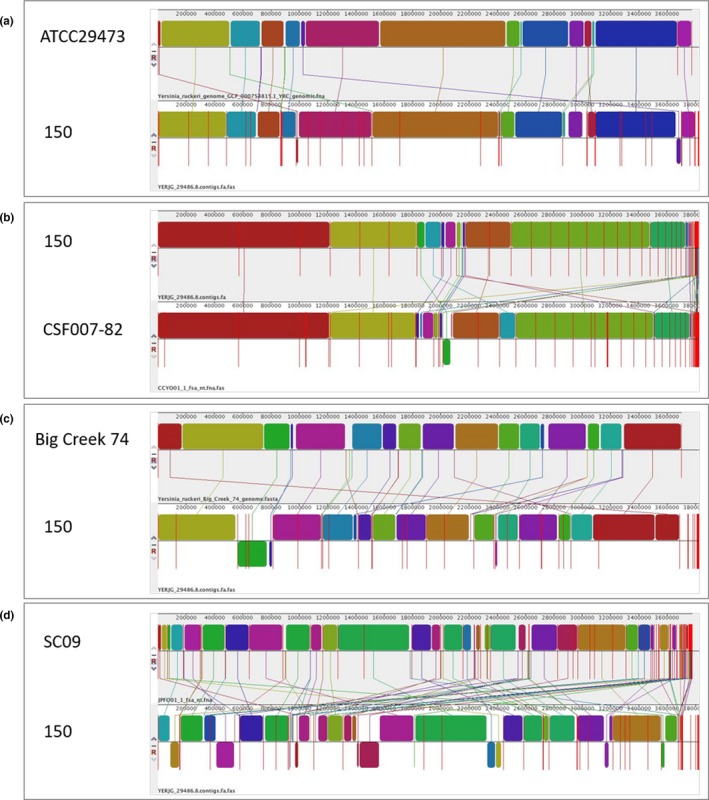
Figure 1.

Chromosome alignments of Y. ruckeri 150 and (a) ATCC29473, (b) CSF007‐82, (c) Big Creek 74, and (d) SC09 using progressive Mauve. Local collinear blocks (LCBs) of conserved sequences among the strains are represented by rectangles of the same color. When these are above the chromosome (black line) they indicate the forward orientation and when they are positioned under the chromosome, the reverse orientation. Red lines represent contig limits. Connecting lines can be used to visualize genetic rearrangements
