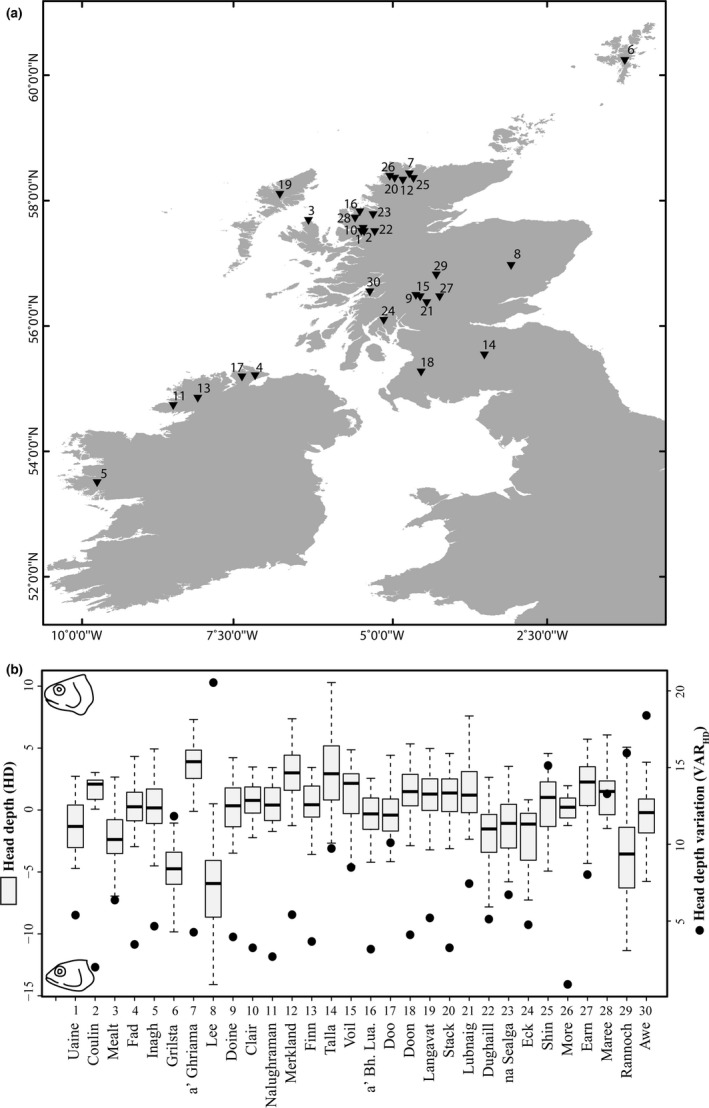
Figure 1.

(a) Sampling sites of Arctic charr from the British Isles. Lakes are ranked according to their score on PC1 (or based on surface area in case they could not be included in the PCA), with low numbers indicating small, shallow, and species‐poor lakes while large numbers indicate greater surface area, deeper, and more species‐rich lakes. Lake names are listed with associated number in panel b. (b) Distribution of head depth is shown on the left y‐axis in gray boxes (black bar within box = median; whiskers = ± 1.5 IQR [outliers excluded for visualization]) and variation in head depth (VARHD) on the right y‐axis (black dots) for all individuals and across all lakes (total N = 1,091). Abbreviations: a’ Bh. Lua. = a’ Bhaid Luachraich
