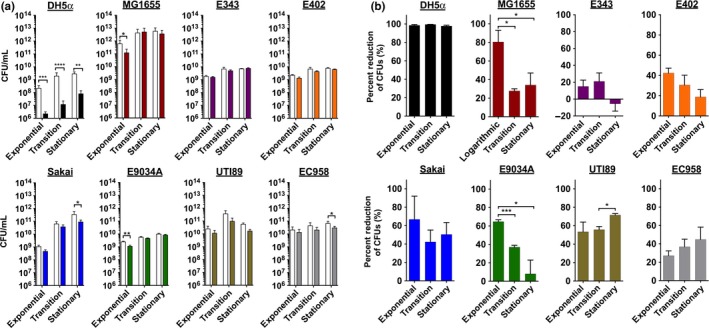
Figure 2.

CFU reduction of different E. coli strains in response to blue light irradiation (BLI)455 at different growth phases. (a) Comparison of CFUs for unexposed (solid colored bars) and exposed (white bars) samples during exponential, transition, and stationary growth phases. All experiments were repeated a minimum of three times and analyzed via a Student t test. *, p < .05, **, p < .01; ***, p < .001; ****, p < .0001. (b) Comparison of percent reduction of CFUs with analyses of the changes over growth phases. The following strains are represented: phylogenetic group A strains DH5α (laboratory‐adapted) and MG1655 (K‐12); group B1 strains E343 and E402 (nonpathogenic isolates); group B2 UPEC strains UTI89 and EC958 (multi‐drug resistant); group D ETEC strain E9034A; and group E EHEC O157:H7 strain Sakai. Data represent the mean of three or more independent experiments. All experiments were repeated a minimum of three times and analyzed via One‐way anova. *, p < .05; ***, p < .001
