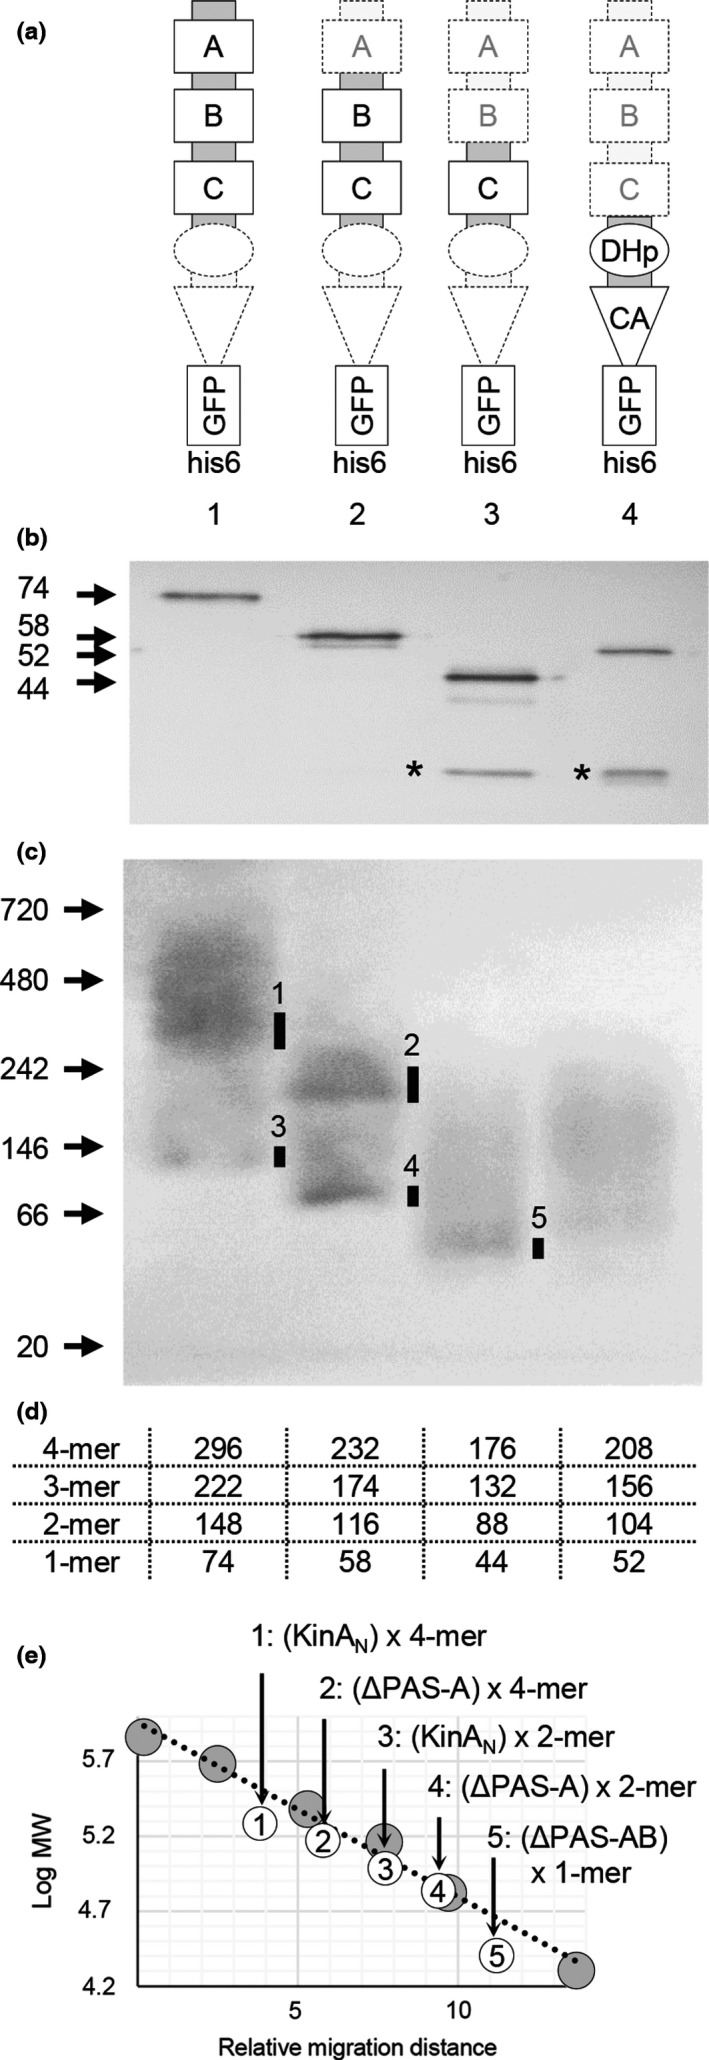
Figure 4.

Complex formation of KinA and its truncated proteins analyzed by BN‐PAGE. (a) Proteins were overexpressed under the control of an IPTG‐inducible promoter in the KinA‐deleted (ΔkinA) B. subtilis strains MF7622 (KinAN‐GFP‐his6, 1), MF7623 (PAS‐BC‐GFP‐his6, 2), MF7624 (PAS‐C‐GFP‐his6, 3), and MF7625 (KinAC‐GFP‐his6, 4). (b) Overexpressed proteins were purified with Ni‐NTA beads and examined by 16% SDS‐PAGE to verify the size (arrows at left) and purity. An approximately 26‐kDa band corresponding to the GFP protein was detected besides the GFP fusion protein in lanes 3 and 4 (denoted as *). (c) Purified proteins were examined by BN‐PAGE (4–16% gradient gel). Size markers are indicated in kDa at left. Major bands are indicated with bars on the panel. (d) The molecular masses of the monomer (1‐mer), dimer (2‐mer), trimer (3‐mer), and tetramer (4‐mer) of the GFP‐his6‐tagged proteins are shown. (e) A linear regression plot of log molecular mass (y‐axis) against relative migration distance (x‐axis) for each of the molecular mass standards (gray circles) and tested proteins (open circles). Numbers in the open circles correspond to those in the gel image in panel C. Tested proteins are indicated as KinAN‐GFP‐his6 (N), PAS‐BC‐GFP‐his6 (ΔPAS‐A), PAS‐C‐GFP‐his6 (ΔPAS‐AB), and KinAC‐GFP‐his6 (C)
