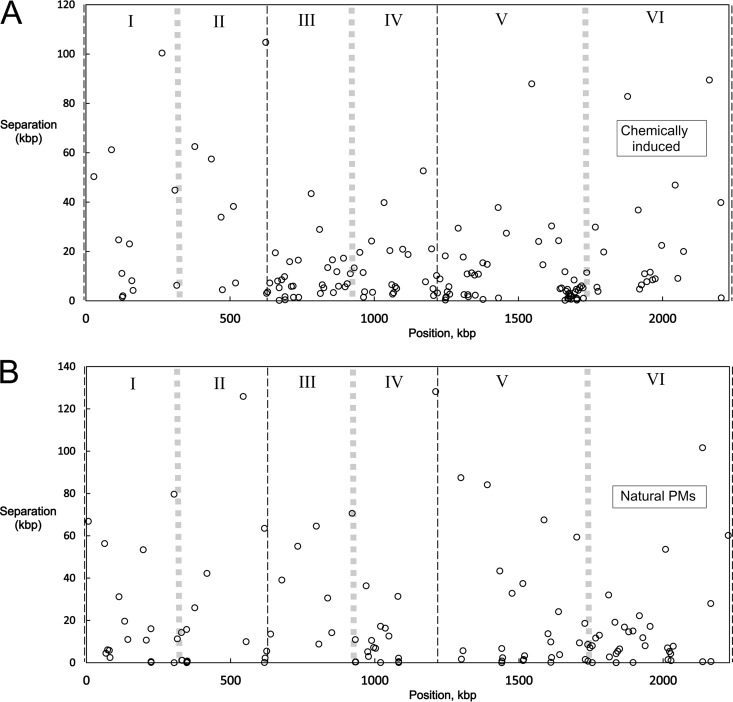
FIG 5.
Spatial distributions of mutations. The distance between adjacent mutations is plotted as a function of the position of the second mutation of the pair; positions refer to the DSM639 sequence of Chen et al. (23). The thin black dashed lines at kbp 0, 579, and 1197 mark the three origins of replication; the thick gray lines midway between the origins mark the regions of presumed replication termination. (A) One hundred forty-eight mutations identified in eight MNNG-treated strains. (B) One hundred twenty-four small polymorphisms identified in eight nonmutagenized strains.

