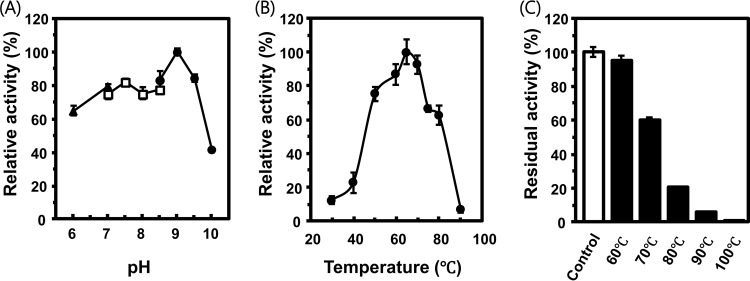
FIG 3.
Optimal pH and temperature for the activity and thermotolerance of the enzyme. (A) Nicotinamidase activities at different pHs are shown. Triangles, squares, and circles represent activities in different buffers (MES, HEPES, and CHES, respectively). Activities are normalized to the maximum activity at pH 9 and are shown as percentages. (B) Activities at different temperatures are shown. Activities were normalized to the maximum activity at 65°C and are shown as percentage. (C) Residual activities after heat treatment at different temperatures are shown. These activities were normalized by the enzymatic activity without heat treatment (control) and are shown as percentages. Averages and the standard errors from triplicates are shown.

