
Fig. 5.
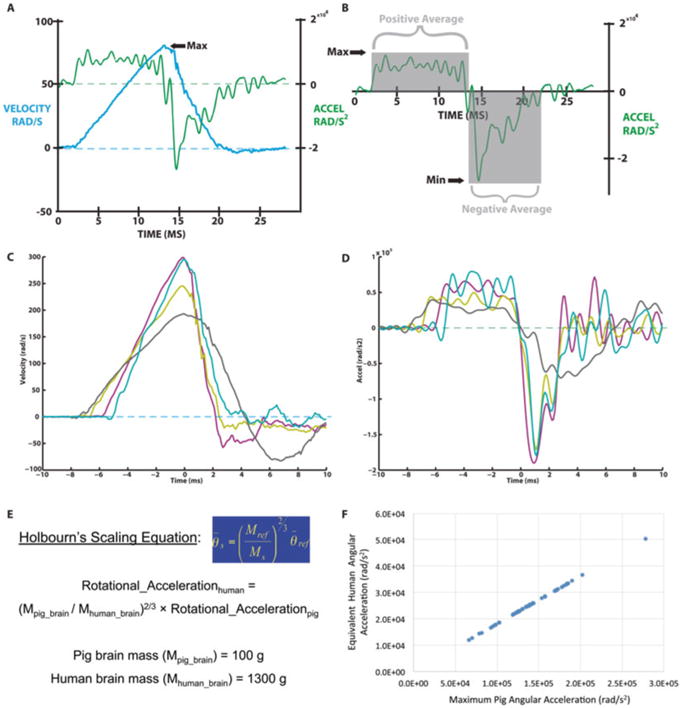
HYGE kinematics and scaling to human inertial TBI. (a) Representative concurrent angular velocity and angular acceleration traces. (b) Angular acceleration trace highlighting the acceleration and deceleration phases. (c-d) Overlay of multiple color-coded (c) angular velocity and (d) angular acceleration traces to show changes in waveform slopes and duration for various rotational scenarios. (e) Holbourn's Scaling Equation and relevant assumptions to scale head rotational loading from humans to pigs. (f) For a fixed ratio of brain masses, angular acceleration scales linearly between humans and pigs