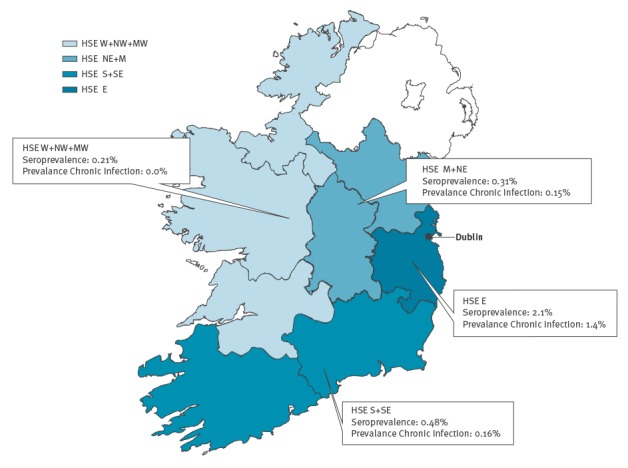
Figure 2.
Seroprevalence and prevalence of chronic hepatitis C virus infection by region, Ireland, 2014–2016
HSE: Health Service Executive; M: Midlands; MW: Mid West; NE: North East; NW: North West; S: South; SE: South East; W: West.

Seroprevalence and prevalence of chronic hepatitis C virus infection by region, Ireland, 2014–2016
HSE: Health Service Executive; M: Midlands; MW: Mid West; NE: North East; NW: North West; S: South; SE: South East; W: West.
