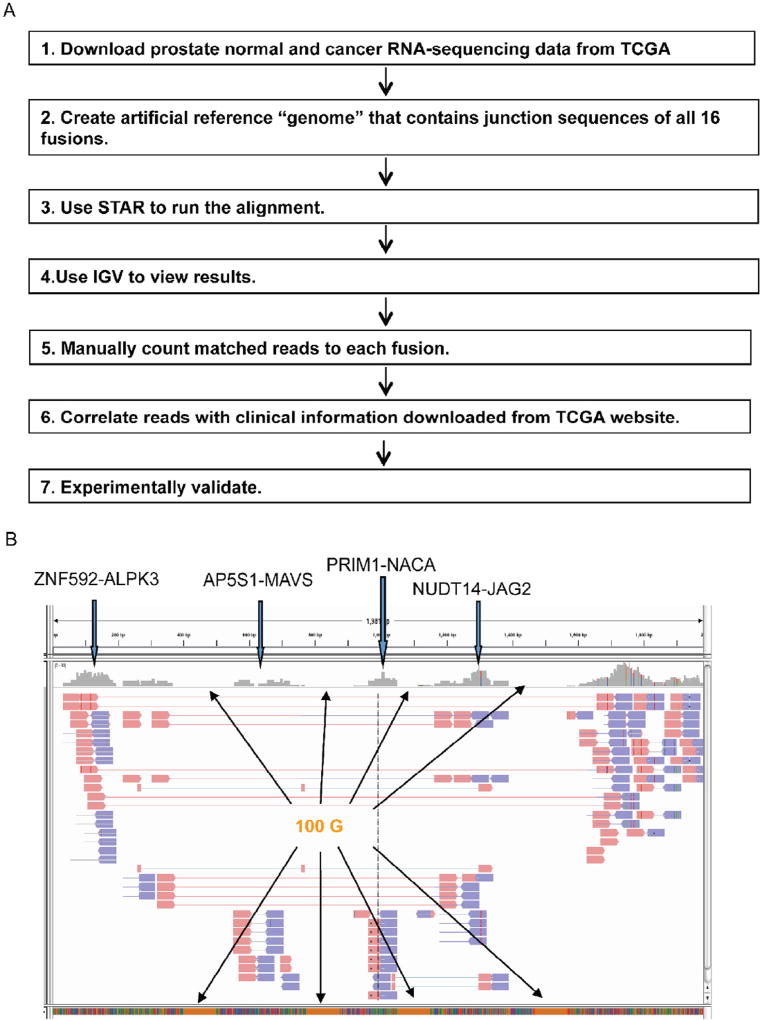
Fig. 1.
Experimental flow to quantify the 16 fusion RNAs, and investigate their clinical implications. A. We modified STAR to allow for detection of 16 fusions simultaneously. Each fusion sequence contains at least 100 bp from both sides of the fusion junction. We concatenated them into one sequence, and used it as the reference “genome”. For the ease of analyzing and viewing, we inserted 100 Gs between every two fusion sequences. We then counted the aligned read pair numbers across the fusion junction using IGV. For spanning reads, at least 10 bp extending past the junction sequence was considered a match. Clinical data from TCGA was used to find any correlation regarding the expression of the fusions. Significant findings were then validated experimentally. B. A screenshot of IGV view. Four fusions are shown here. The stretches of orange blocks at the bottom are the 100 Gs added between every two fusions. Paired-end split or spanning reads across fusion junction were counted. Pink arrowheads are reads from one end. Blue arrowheads are reads from the other end. (For interpretation of the references to color in this figure legend, the reader is referred to the web version of this article.)

