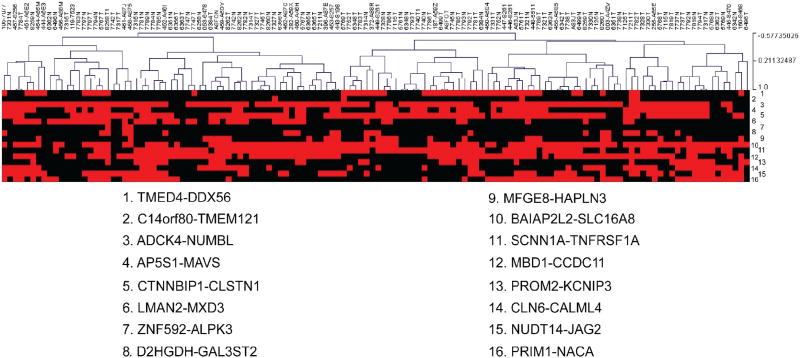
Fig. 2.
Clustering analysis. 130 TCGA samples were clustered based on the presence (red) or absence (black) of the 16 fusion RNAs. None of the 16 fusions were cancer specific. Five pairs of matched normal and cancer samples were clustered together, indicating similarities in the fusion RNA profiles of these matched pairs. (For interpretation of the references to color in this figure legend, the reader is referred to the web version of this article.)

