
Figure 3.
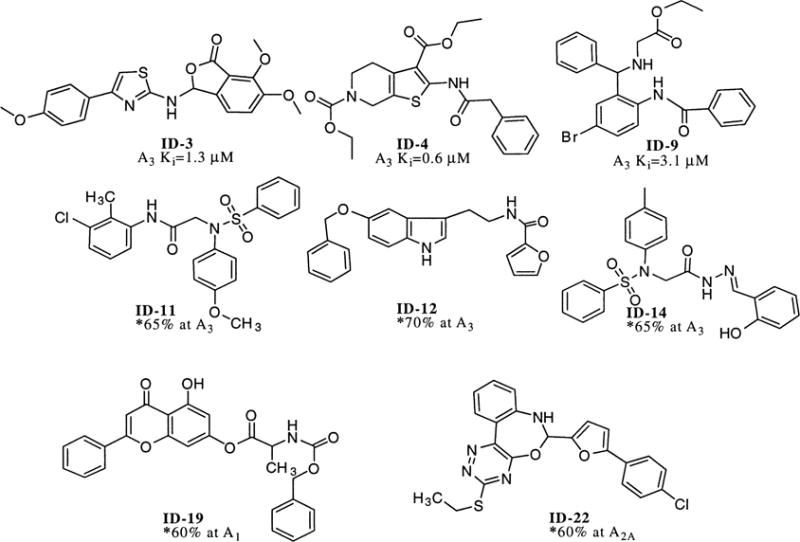
Illustrative structures of the active compounds referred to in Figure 2 and values obtained in hA3 receptor binding assays. *Amount displaced (at 10−5 M) in radiologand binding assay.
Official websites use .gov
A
.gov website belongs to an official
government organization in the United States.
Secure .gov websites use HTTPS
A lock (
) or https:// means you've safely
connected to the .gov website. Share sensitive
information only on official, secure websites.
Illustrative structures of the active compounds referred to in Figure 2 and values obtained in hA3 receptor binding assays. *Amount displaced (at 10−5 M) in radiologand binding assay.